
By Chris Ganatti, Wisdomtree Investments
Special to the Financial Independence Hub
 It seems like everywhere across the investment landscape in these days there is talk about “factors.” While this isn’t necessarily a new discussion (research has been done for decades regarding the drivers of excess returns within equities), it is easier than ever to pick and choose the factors to which you would prefer exposure.
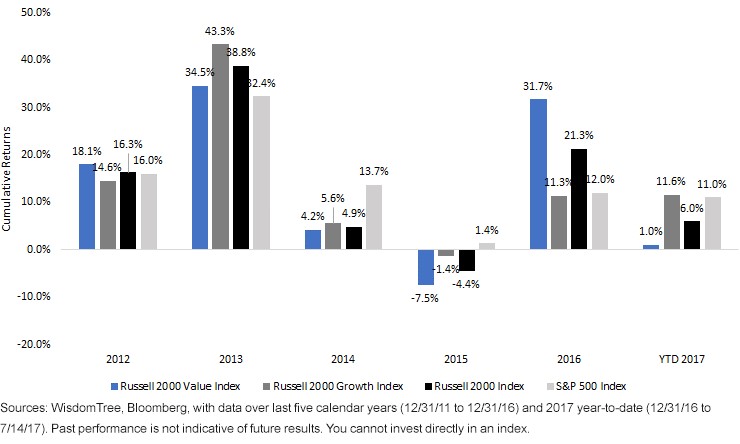
When people get excited about changes — changes in policy, changes in growth expectations, changes in political leadership — we’ve tended to see this excitement show up in the behavior of small-cap stocks. We saw this most recently during the “Trump trade,” with the bulk of the performance response coming between the November 8, 2016, election victory and the January 20, 2017, inauguration.
- In 2012 and 2014, the Russell 2000 Value Index and the Russell 2000 Growth Index performed very similarly. Even the approximate 9% difference between these indexes in 2013 wasn’t particularly noteworthy because U.S. equity market indexes across the board tended to be up 30% to 40% that year.
- The most recent “tough” year for small caps was 2015, and it was clear that the Russell 2000 Value Index was the laggard, as the Russell 2000 Growth Index was nearly flat. But 2016 saw greater than 20% outperformance of the Russell 2000 Value Index vs. the Russell 2000 Growth Index. In 2017 through July 14, these indexes have reversed again, with the Russell 2000 Growth Index now outperforming the Russell 2000 Value Index by 1,000 basis points (bps).
Value, Growth, Core…What’s the “Right” Choice?
Based on what we’re seeing in more recent index behavior, trying to time the shift between value and growth could carry with it a significant opportunity cost and the risk of being incorrect. Intuitively, one might say, “why not just own all the stocks?,” which could then lead to the Russell 2000 Index: very much the status quo choice. But as we mentioned before, it has never been easier to fine-tune exposure to a market segment through the use of factors.
Over the long term, did Size or “Size-Plus” lead to outperformance?

- Over this very long period, Small Cap-Value (defined as a focus on small firms with high book-to-market value ratios) had the strongest returns and, by a small margin, the lowest risk.
- If we knew that Small Cap-Value would always outperform over all periods, then there would be no need to look at any other factors, but no factor outperforms in all markets, of course. Since “growth” isn’t a long-term alpha-generating factor, High Quality (a focus on firms with higher operating profitability) offers the potential for an interesting foil to value.
- Instead of just “owning all of the stocks,” which we alluded to with the Russell 2000 Index choice earlier, something that we find to be of greater interest is intelligently blending factors. A 50-50 blend of Small Cap-Value and Small Cap-High Quality led to outperformance over “just holding them all,” as well as enhanced risk/return characteristics.
Better risk-adjusted performance
If we ask clients what they really want from the ever-expanding toolkit of options in portfolio construction, the single most popular answer is “better risk-adjusted performance.” One way to put a number to this is through the Sharpe ratio. Over the long-term period going back to June 1963, we asked a simple question: Over 3-, 5- and 10-year rolling periods, did Small Cap-Value, Small Cap-High Quality or the Blended Approach provide the greatest chance of a Sharpe ratio stronger than just “owning all the small caps?”
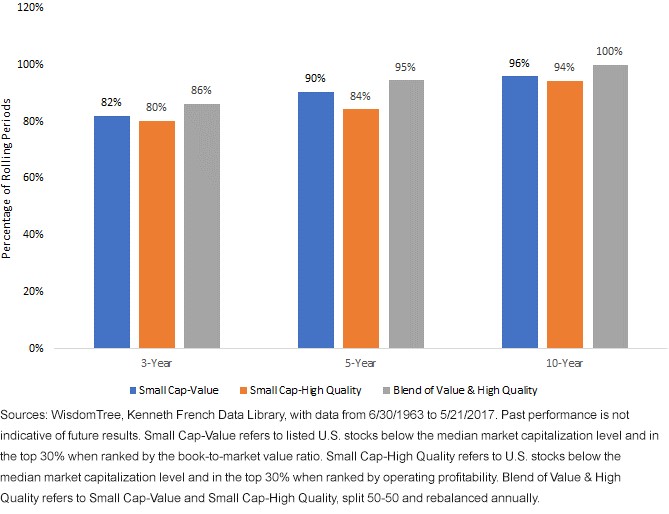
- The Blend had a stronger Sharpe ratio a greater percentage of the rolling periods than either Value or High Quality independently. This shows that there is enough of a benefit from the factors delivering performance at different times that holding both in tandem was actually stronger than looking at either individually.
WisdomTree designed its Quality Dividend Growth approach with this blend in mind
For more than 11 years, the WisdomTree SmallCap Dividend Index has generated a strong live performance track record. While including only dividend payers is one way to avoid lower-quality small caps, in 2013, WisdomTree developed a new approach: still focused on dividend payers (therefore tilted toward value) but also ranking stocks by their three-year average return on equity and return on assets. The WisdomTree U.S. SmallCap Quality Dividend Growth Index represents the marriage of Quality and Value, similar to the blends we studied above.
 Christopher Gannatti began at WisdomTree as a Research Analyst in December 2010, working directly with Jeremy Schwartz, CFA®, Director of Research. He is involved in creating and communicating WisdomTree’s thoughts on the markets, as well as analyzing existing strategies and developing new approaches. He received his MBA in Quantitative Finance, Accounting, and Economics from NYU’s Stern School of Business in 2010, and he received his bachelor’s degree from Colgate University in Economics in 2006.
Important Risks Related to this Article

Investments focusing on certain sectors and/or smaller companies increase their vulnerability to any single economic or regulatory development.

Quite hard to find the MER. Also seems that this fund trailed the russel 2000 since inception and the s&p 500 by roughly 10% since 2013. I like the idea of the fund small cap value but it seems easier to buy vti and wait until retirement.