
By Kevin Flanagan, WisdomTree Investments
Special to the Financial Independence Hub
Without a doubt, one of the better-performing sectors in the fixed-income arena over the last year or so has been the U.S. corporate bond market. Indeed, both the high-yield (HY) and investment-grade (IG) asset classes have enjoyed visibly positive returns both in 2016 and thus far in 2017, with HY registering specifically robust readings. Against this backdrop, questions have surfaced as to whether these types of performance can be sustained for the remainder of 2017.
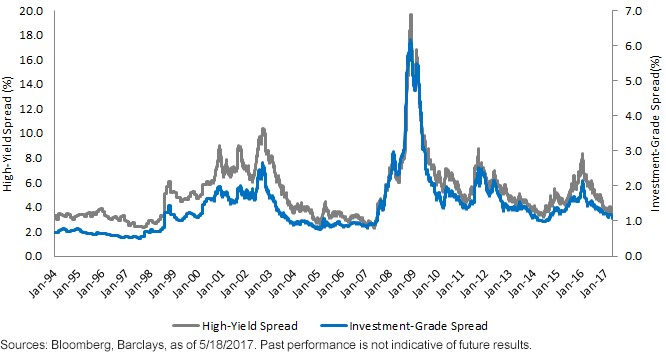
And here we are, roughly five months into the calendar, and the question remains: Can the U.S. corporate bond market continue to produce positive outcomes? Oftentimes, market participants tend to focus on more recent trends, and in the process apply their findings to determine whether an asset could be overbought or oversold. In order to put recent developments in U.S. corporates into some perspective, we thought it would be a useful exercise to take a look at how HY and IG spreads have fared over a longer period (See chart at the top of this blog.)
So, where exactly are U.S. corporate bond spreads? According to the Bloomberg Barclays U.S. Aggregate Corporate Index, IG spreads have narrowed by 10 basis points (bps) since the end of the year, and stood at 113 bps as of this writing. This is the lowest level since the latter half of 2014. On the HY front, the Bloomberg Barclays U.S. Corporate High Yield Index shows the spread at 376 bps, a decline of 33 bps from the year-end 2016 tally, and also resides at levels last seen almost three years ago.
A slightly more dramatic way of looking at the current readings is to focus on how much these spreads have come in since the recent high watermarks were posted in February of last year. From this key risk-off period, IG spreads have declined by more than 100 bps, and an eye-popping 463 bps for HY. It is this combination of recent spread-narrowing and current levels that has prompted the aforementioned questions.
Some historical perspective
This is where some historical perspective is in order, specifically: Have we entered uncharted territory?The graph (at the top of this blog) certainly reveals many past peaks and valleys in U.S. corporate spreads, even without the impact of the financial crisis and great recession of 2008–2009. More importantly, the graph also reveals that the current spread readings for both IG and HY have been in this territory before, and even lower, most recently during the 2003–2007 timeframe.
For the four-year period prior to the beginning of the financial crisis, the average spread for IG was 93 bps, and 349 bps for HY, which is below current readings. Taking it one step further, the low watermarks during that timeframe were 76 bps and 233 bps for IG and HY, respectively. While we would not expect to revisit these lows this time around, we do feel it provides a good frame of reference. In the case of the IG low point, it was actually printed right in the middle of the Federal Reserve’s (Fed) last round of rate hikes back in 2005.
Conclusion
The bottom line message is that U.S. credit spreads may not necessarily have to widen in any visible fashion from their current postings, especially if there are no significant risk-off events to contend with. To be sure, continued economic growth (most economists do expect a noticeable rebound in Q2 real GDP) and a gradual, deliberate Fed policy could provide a steady underpinning for both the IG and HY markets in the months ahead.
Unless otherwise noted, source is Bloomberg, as of 5/18/2017.
 Kevin Flanagan is the Senior Fixed Income Strategist for WisdomTree’s Investment Strategy group. In this role, he contributes to the asset allocation team, writes fixed income-related content and travels with the sales team, conducting client-facing meetings and providing expertise on WisdomTree’s existing and future bond ETFs. Prior to joining WisdomTree, Kevin spent 30 years at Morgan Stanley, where he was most recently a Managing Director. Kevin has an MBA from Pace University’s Lubin Graduate School of Business, and a B.S in Finance from Fairfield University.
Commissions, management fees and expenses all may be associated with investing in WisdomTree ETFs. Please read the relevant prospectus before investing. WisdomTree ETFs are not guaranteed, their values change frequently and past performance may not be repeated.

Past performance is not indicative of future results. This material contains the opinions of the author, which are subject to change, and should not to be considered or interpreted as a recommendation to participate in any particular trading strategy, or deemed to be an offer or sale of any investment product and it should not be relied on as such. There is no guarantee that any strategies discussed will work under all market conditions. This material represents an assessment of the market environment at a specific time and is not intended to be a forecast of future events or a guarantee of future results. This material should not be relied upon as research or investment advice regarding any security in particular. The user of this information assumes the entire risk of any use made of the information provided herein. Neither WisdomTree nor its affiliates provide tax or legal advice. Investors seeking tax or legal advice should consult their tax or legal advisor. Unless expressly stated otherwise the opinions, interpretations or findings expressed herein do not necessarily represent the views of WisdomTree or any of its affiliates.

“WisdomTree” is a marketing name used by WisdomTree Investments, Inc. and its affiliates globally. WisdomTree Asset Management Canada, Inc., a wholly-owned subsidiary of WisdomTree Investments, Inc., is the manager and trustee of the WisdomTree ETFs listed for trading on the Toronto Stock Exchange.
