By Jeff Weniger, CFA, WisdomTree Investments
Special to the Financial Independence Hub
Canada’s stock market construction may be more than just a portfolio risk; it is arguably a systemic one.
If, for whatever reason, the Canadian financial system were to encounter serious difficulty, investors would be hit by a one-two punch. The attendant economic weakness would hang over the stock market, and it would be the very companies that dominate the stock market that would be battling demons. Canada’s top-heaviness, where more than $2 of every $5 in the MSCI Canada Index is in financial stocks, is not normal or reassuring for a developed economy.1 We should stop making like it is.
In fact, it would be better for the TSX if the “T” stood for Tokyo, at least on the sector diversification side of things, as we show below.
Stuck in the mud
Everywhere you turn, countries that are top heavy are doing something about it. Saudi Arabia, for example, sees the writing on the wall for fossil fuels; either the price mechanism may cause a phase-down in oil demand in the next quarter century, or environmental action groups will crush demand themselves. Either way, the ruling Crown Prince Mohammad bin Salman is keen to avoid state failure if a bleak future for oil comes to pass. That country will soon float an IPO of Aramco, the state-run oil behemoth that may be equal to several ExxonMobils. Proceeds will be diverted into tech, infrastructure—anything that isn’t oil.
China, too, realized it was turning into a one-trick pony. After building its export machine after Mao’s death, the time for middle-class demand eventually arrived. When it joined the WTO at the turn of the century, the country’s household consumption was 46% of GDP. It fell to 36% of GDP in 2007, but it has been rising ever since; sights are set on 40% this year.2
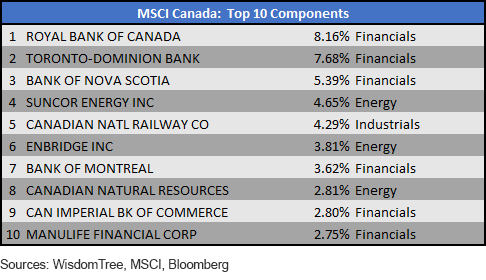
But not Canada. The hat is hung on the same two sectors, as always. Nine of this country’s top 10 corporations by market capitalization fit the bill (figure 1). This, in a country where the average investor has 86% of assets inside these borders.3
That is concentration on top of concentration.
Figure 1: Canada’s Sector Concentrations
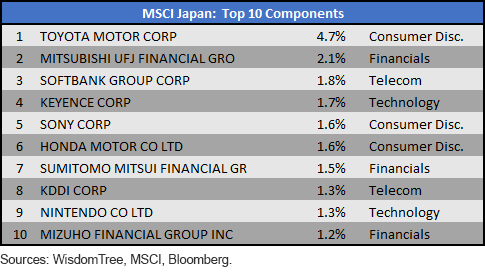
Compare the “T” for Toronto with another T: Tokyo. Figure 2 shows Japan’s national champions. They don’t dominate allocations quite like Canada’s do.
Figure 2: Japan’s Largest Companies
In figure 3, we “Japanify” Canada.
In it, we take the sector that each of Japan’s top 10 companies inhabits, plugging the largest Canadian companies in each slot. For example, for the first one, we replace the consumer discretionary company listed in Japan (Toyota) with Magna, Canada’s largest company in that sector.
The new list has much more of a “sleep at night” feel, with an assortment of Canada’s pride, without having to resort to high exposures to RBC, TD, Scotia and on and on. It looks more like the Canada we know, shop in and do business with, beyond just the big banks.
Figure 3: Canada, if Japanese
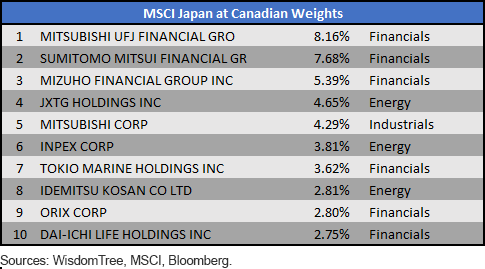
Look at it from the perspective of figure 4, which turns Japan Canadian. Would anyone feel comfortable buying a market capitalization-weighted Japanese index fund if it were “Torontoized”? If we give the Japanese banks 8%, 7%, 5% allocations, again and again, bank after bank, figure 4 is what we get. It would be unnerving for Japan, so why is it OK for Canada? It’s not.
Figure 4: Japan’s Top 10, if Canadian
Figure 5 shows the WisdomTree Canada Quality Dividend Growth Index. It doesn’t care about market capitalizations, just fundamentals like profitability, earnings growth and willingness to pay dividends. It currently picks up none of the big banks, instead capturing so many of the firms that MSCI Canada and the S&P/TSX Composite shun. It also does it with a large-/mid-/small-cap mix that is similar to that of the TSX Composite.
Figure 5: WisdomTree’s Canadian Equity Approach, Top 10
Interestingly, financials is one of the WisdomTree Index’s “Big Three” sectors, but not because of the banks. A company like Thomson Reuters is technically a financial company, but face it: it is not in the same day-to-day business as the giants at King and Bay.
Normal Country Index Construction
Figure 6 shows how a “normal” index like the MSCI Japan stacks up against the MSCI Canada and WisdomTree’s Canadian equity Index. Canada’s largest company, RBC, is only three times larger than the 10th, but that’s because No. 10 is itself a monster (Manulife). But from there it gets stretched out; RBC is nearly seven times the weight in the MSCI Index as No. 20 (National Bank of Canada).
For a diversified approach to Canada, where the sectors are spread out, and where the 20th or 25th largest holding matters, WisdomTree’s Canadian equity Index may be worth a look. The ETF that tracks it is DGRC.
Figure 6: Index Characteristics
1Sources: WisdomTree, Bloomberg, MSCI. All data in this report as of 5/7/18.
2Sources: World Bank and OECD national accounts data.
3Source: AGF Investor Perspectives Survey, 2014. AGF commissioned Nielsen to conduct the survey
1Sources: WisdomTree, Bloomberg, MSCI. All data in this report as of 5/7/18.
2Sources: World Bank and OECD national accounts data.
3Source: AGF Investor Perspectives Survey, 2014. AGF commissioned Nielsen to conduct the survey
 Jeff Weniger, CFA serves as Asset Allocation Strategist at WisdomTree. Jeff has a background in fundamental, economic and behavioral analysis for strategic and tactical asset allocation. Prior to joining WisdomTree, he was Director, Senior Strategist with BMO from 2006 to 2017, serving on the Asset Allocation Committee and co-managing the firm’s ETF model portfolios. Jeff has a B.S. in Finance from the University of Florida and an MBA from Notre Dame. He is a CFA charter holder and an active member of the CFA Society of Chicago and the CFA Institute since 2006. He has appeared in various financial publications such as Barron’s and the Wall Street Journal and makes regular appearances on Canada’s Business News Network (BNN) and Wharton Business Radio.
Commissions, management fees and expenses all may be associated with investing in WisdomTree ETFs. Please read the relevant prospectus before investing. WisdomTree ETFs are not guaranteed, their values change frequently and past performance may not be repeated.

Past performance is not indicative of future results. This material contains the opinions of the author, which are subject to change, and should not to be considered or interpreted as a recommendation to participate in any particular trading strategy, or deemed to be an offer or sale of any investment product and it should not be relied on as such. There is no guarantee that any strategies discussed will work under all market conditions. This material represents an assessment of the market environment at a specific time and is not intended to be a forecast of future events or a guarantee of future results. This material should not be relied upon as research or investment advice regarding any security in particular. The user of this information assumes the entire risk of any use made of the information provided herein. Neither WisdomTree nor its affiliates provide tax or legal advice. Investors seeking tax or legal advice should consult their tax or legal advisor. Unless expressly stated otherwise the opinions, interpretations or findings expressed herein do not necessarily represent the views of WisdomTree or any of its affiliates.

“WisdomTree” is a marketing name used by WisdomTree Investments, Inc. and its affiliates globally. WisdomTree Asset Management Canada, Inc., a wholly-owned subsidiary of WisdomTree Investments, Inc., is the manager and trustee of the WisdomTree ETFs listed for trading on the Toronto Stock Exchange.


