By Kevin Flanagan, Senior Fixed Income Strategist, WisdomTree
Special to the Financial Independence Hub
One of the linchpins supporting the U.S. Treasury (UST) market in recent years has been the relative yield advantage against the rates that have existed among the sovereign debt of other G7 nations. In the post-U.S. presidential election landscape, fixed-income investors have witnessed a back-up in G7 government bond yields on a global basis, and questions have arisen as to whether said advantage would remain a key contributor to the UST market outlook in 2017, now that the “zero rate club” has shrunk. The best way to answer this query is to examine just who exactly has been buying and who’s been selling, with the first data point looking at developments from the foreign perspective.
Each month, the Treasury Department releases statistics on this front, but it should be noted that the actual data are provided with a one-month lag. Thus, the latest report did not provide any fresh details on how 2017 got started, but it does offer interesting information for calendar year 2016. The report itself is called Treasury International Capital data, or TIC, as it is known in fixed income trading circles, and includes the figures for “Major Foreign Holders of Treasury Securities.”

In terms of total foreign holdings of U.S. Treasuries, last year witnessed a decline of $142.3 billion, following on the heels of 2015’s modest $11.5 billion shortfall. For the record, as recently as 2014, foreign UST holdings surged by nearly $365 billion. It should be noted that the result was a bit of a tale of two cities. Specifically, the first half of the year witnessed a net increase through June, while the second half of the year came in on the negative side of the ledger.
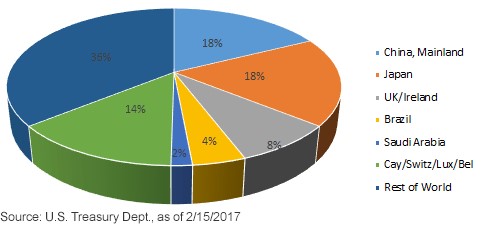
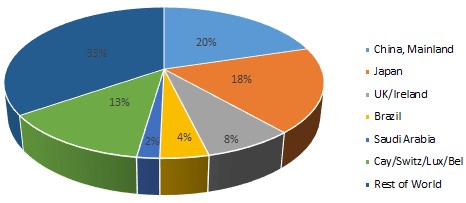
Clearly, when this topic is discussed, the focus goes directly to Mainland China, and last year offered market participants some definite fodder for that discussion. China’s UST holdings fell a hefty $188 billion in 2016, officially dropping the country to number two on the list, behind Japan. As a result, China’s share of the total foreign tally declined to 17.6% (18.2% for Japan), versus a reading of a little over 20% in 2015, and the lowest figure since 2006. To provide some perspective regarding this development, a peak reading of 28% was recorded in 2011.
Interestingly, UST purchases in Europe were on an upward trajectory. Net buying was observed in Ireland, the UK, Germany, the Netherlands and Italy. In fact, Ireland is now number three on the overall list in terms of total holdings, behind only Japan and China, albeit by a rather large margin. Also in the plus column of note were South Korea and Canada. As a note, in the pie charts, we lump the Cayman Islands, Switzerland, Luxembourg and Belgium together because, according to Treasury, they are considered countries/areas where Treasuries are sometimes held in custody on behalf of other nations. For the record, this grouping saw an increase of roughly $34 billion last year.
Conclusion
Back to our original question: What does it all mean for the broader UST market? Although global fixed-income investors may look more inward to their own nations’ sovereign debt, now that rates have risen, Treasuries still maintain a relative yield advantage, as witnessed by the fact that the spread between the UST 10-Year Note and the comparable-maturity German bund is at its widest since 1989. In addition, reports have surfaced suggesting that domestic demand in the U.S. has picked up, especially from liability-driven investors such as pension funds and insurance companies. In our opinion, UST market trends in the months ahead will be predicated on the factors investors have witnessed to date U.S. fiscal policy and how it could impact the economic/inflation backdrop, Federal Reserve policy considerations, and let’s not forget, the elections within the eurozone that began early in March.
 As part of WisdomTree’s Investment Strategy group, Kevin Flanagan serves as Senior Fixed Income Strategist. Prior to joining WisdomTree, Kevin spent 30 years at Morgan Stanley, where he was most recently a Managing Director. He was responsible for tactical and strategic recommendations and created asset allocation models for fixed income securities.
Commissions, management fees and expenses all may be associated with investing in WisdomTree ETFs. Please read the relevant prospectus before investing. WisdomTree ETFs are not guaranteed, their values change frequently and past performance may not be repeated.

Past performance is not indicative of future results. This material contains the opinions of the author, which are subject to change, and should not to be considered or interpreted as a recommendation to participate in any particular trading strategy, or deemed to be an offer or sale of any investment product and it should not be relied on as such. There is no guarantee that any strategies discussed will work under all market conditions. This material represents an assessment of the market environment at a specific time and is not intended to be a forecast of future events or a guarantee of future results. This material should not be relied upon as research or investment advice regarding any security in particular. The user of this information assumes the entire risk of any use made of the information provided herein. Neither WisdomTree nor its affiliates provide tax or legal advice. Investors seeking tax or legal advice should consult their tax or legal advisor. Unless expressly stated otherwise the opinions, interpretations or findings expressed herein do not necessarily represent the views of WisdomTree or any of its affiliates.

“WisdomTree” is a marketing name used by WisdomTree Investments, Inc. and its affiliates globally. WisdomTree Asset Management Canada, Inc., a wholly-owned subsidiary of WisdomTree Investments, Inc., is the manager and trustee of the WisdomTree ETFs listed for trading on the Toronto Stock Exchange.

