By Kyle Prevost, MillionDollar Journey
Special to Financial Independence Hub
I want to make it clear that the Dogs of the TSX is not something that I created. In fact, it’s actually an American idea. Michael B. O’Higgins wrote a book called the Dogs of the Dow back in 1991, and the idea was later adapted to the Canadian market. I first came across the “Dogs” method of stock picking when MoneySaver magazine started a column titled BTTSX – short for Beating the TSX – dividend stock strategy. (Click here to skip directly to my 2026 picks).
The theory behind the Dogs of the TSX strategy is to look for solid cash-flow-positive stocks that have fallen out of favour for one reason or another. In other words, you’re looking to take advantage of short-term market inefficiency when it comes to the pricing of blue-chip Canadian stocks. A low price and a high dividend results in a high dividend yield.
The chart below illustrates the total return (dividends plus price capital gains) versus the TSX 60 benchmark over the years. Looking at 2025, our Dogs of the TSX portfolio of 10 stocks was very similar to the overall TSX 60 index. In fact, the average return lead that the BTTSX strategy has over 3- and 5-year periods is fairly minor. That said, when we look out over the longer terms, we see consistent outperformance in the range of 2-3% per year.
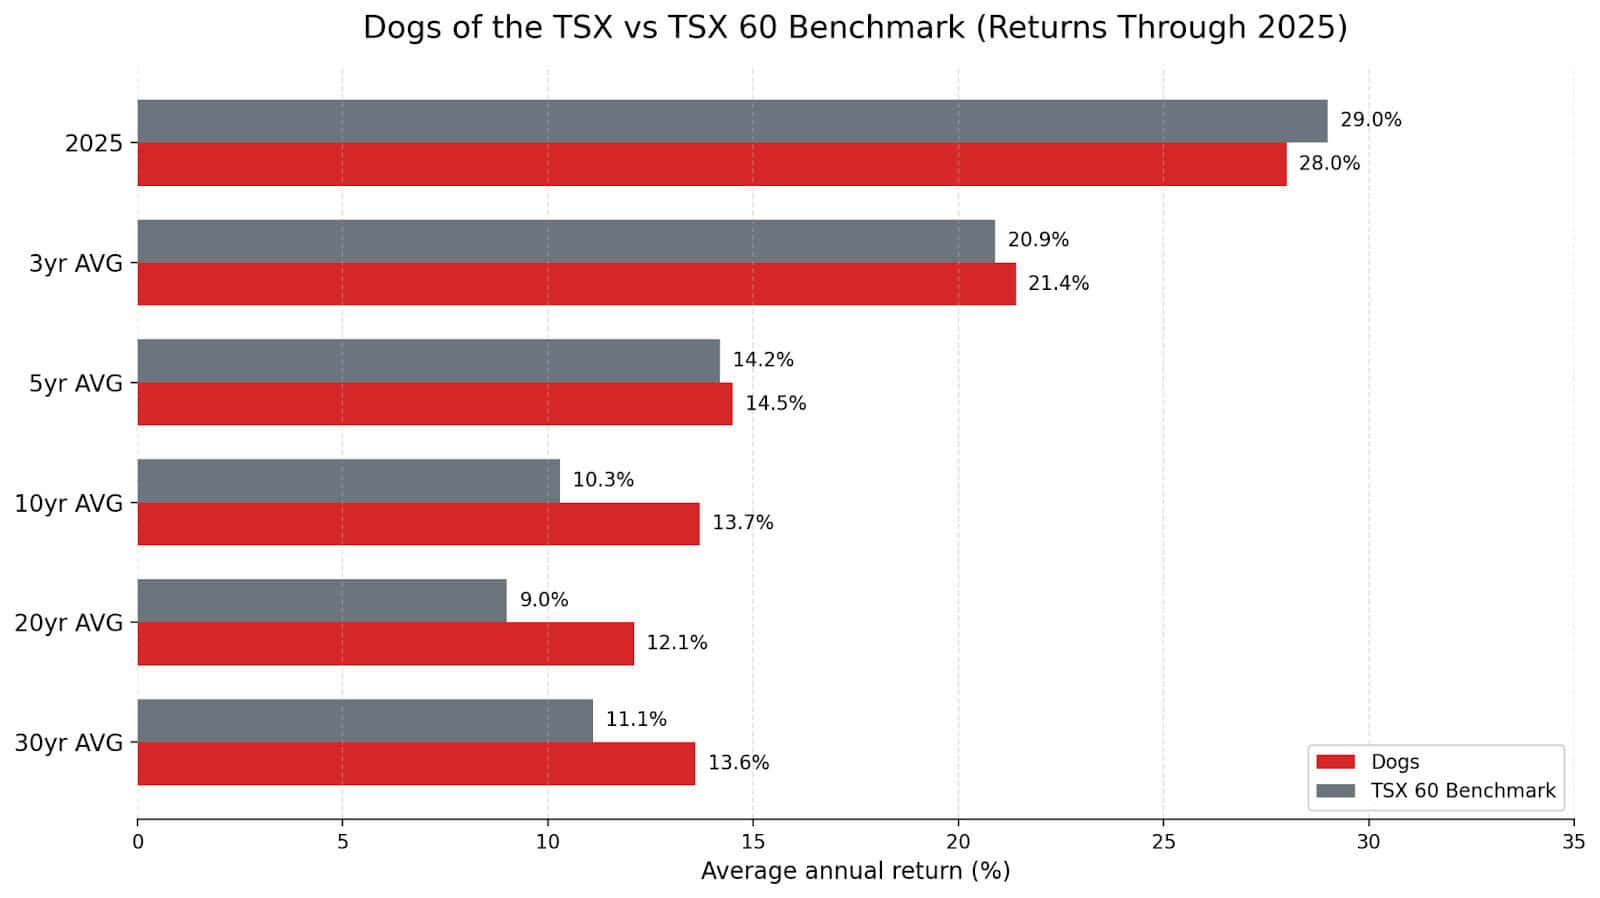
If you had $100,000 invested 30 years ago, the constant difference in compounding would have left you about $2 million richer today had you followed the Dogs of the TSX BTTSX strategy.
When we look back over the last year, the banks had a great year, and the telecommunications companies continued to get beat up. Consequently, we’re going to lose TD off of the list this year (its share price has finally caught up to its dividend payout).
In its pure original form, the Dogs the TSX strategy simply involved ranking the companies in the Toronto Stock Exchange 60 index (aka: TSX 60) by their dividend yield. The highest yield gets the top spot. Then you simply invest equal amounts in all top ten dividend yield stocks.
The idea is that investing in companies that have relatively high free cash flow – but relatively low share prices – is an excellent way to systemically outperform the broader market. No need to pick stock winners with any sort of fancy algorithm – just choose dividend stocks that are out of favour and consequently have high yields.
The average yield for the stocks making the 2026 Dogs of the TSX is about 5.26%. That’s down about 1% from last year – showing that valuations on these companies have raced ahead of their free cash flow and dividend payouts. (In theory, it could also be the case that these companies cut their dividends, but since only BCE did that, we can eliminate that theory.)
In my own implementation of the BTTSX strategy I often eliminate Real Estate Investment Trusts (REITs), and any stocks that have cut dividends OR have insanely high payout ratios (foreshadowing a future dividend cut). Those rules helped me avoid the Algonquin disaster in years past. I didn’t trim much of my BCE holdings before the cut, and I have to admit that I’m getting nervous about Telus: but haven’t pulled the trigger yet.
You’ll notice that my Dividend Dogs of the TSX list has a lot in common with my Best Canadian Dividend Stocks list that I update monthly. There’s obviously a lot of overlap in selecting value-driven, stable, Canadian company stocks.
Top Canadian Dogs of the TSX Pick for 2026: Emera (EMA)
My 2024 and 2025 Dogs of the TSX picks were identical to one another: Power Corp (POW).
While I looked pretty average in January last year, I look pretty darn smart today! That’s because Power Corp saw a total return of over 75% last year!!
In fact, the share price has done so well, that it has outpaced the dividend, and dropped POW right off the BTTSX list for 2026. The biggest driver was Great-West Life’s robust earnings. On top of that, IGM has quietly stabilized its asset base, and Wealthsimple continues to expand its footprint, with more rumours swirling about that Schedule 1 bank licence approval. Investors are finally pricing in the fact that Power Corp isn’t just a stodgy old financial holding company. It’s a well-run, diversified business with growth levers in both traditional finance and the fintech space.
The other stock I highlighted as a Dogs of the TSX stock to watch was TD Bank: and again, TD did so well (total return of about 70%!) that it’s not on the list this year!
It is nearly impossible to duplicate those results going forward. Those two picks both hit the perfect tailwind, and while I believed they were significantly undervalued 12 months ago, I would have told you that you were crazy if you said they’d have total returns of more than 50%, nevermind 70%!
Now, I’m not nearly as bullish on the overall market going into 2026 as I was in 2025. I don’t see any screaming “buy now” deals out there. That’s why my 2026 Dogs of the TSX pick is Emera.
It’s definitely not a stock that’s going to light up Reddit boards. What it is, is a regulated utility with a high starting yield, visible growth, and a US-expanding business mix that I think the market is still undervaluing.
At its core, Emera is a regulated electric and gas utility operator. More than 90% of its earnings come from regulated sources, and roughly 96% of its assets sit inside rate-regulated frameworks. That price stability is exactly what you want when you’re building a dividend-focused portfolio in a market that feels a bit stretched.
Emera operates across Canada, the U.S., and parts of the Caribbean, but the business is much simpler than the geographic footprint suggests.
The short version is this: Florida’s data center growth is the story. Canada is secondary. Everything else is noise.
Emera’s crown jewel is Tampa Electric, which sits under its TECO Energy subsidiary in Florida. That operation benefits from population growth, constructive regulation, and a steady stream of capital investment tied to grid hardening, electrification, and storm resilience. If you believe Florida continues to grow and data centers continue to put pressure on electrical grids (and all signs point that way), Emera has positioned itself very well.
One of the reasons Emera stands out to me right now is management’s five-year, $20 billion capital plan, announced late in 2025. This isn’t vague guidance. It’s a detailed roadmap that extends 7–8% consolidated rate base growth through 2030, with nearly 80% of that capital earmarked for Florida.
That’s meaningful growth for a regulated utility. And importantly, it’s growth that regulators expect and allow utilities to earn returns on.
Canadian assets (which are mostly through Nova Scotia Power) do introduce some political and regulatory friction. But when I look at where Emera is allocating capital, it’s clear management understands where the best risk-adjusted returns are coming from. The payout ratio is pretty darn high, and the balance sheet carries too much debt for my liking. That said, with interest rates coming down in the US, and regulations coming off the books, I like the short- and medium-term prospects.
In a market where many stocks feel priced for perfection, Emera feels priced for caution. That’s what I’m looking for in 2026.
June 2026 Update: So far so good, Emera. It’s up about 7% on the year, which means that it is slightly outpacing the overall TSX 60 index. When you consider that its dividend is higher than that of a TSX 60 ETF, the gap opens up a bit more. American assets and earnings continue to perform well (as I figured they would). So while it’s not performing as well as my Toromount Industries Dividend King pick, or as well as Power Corp (which just continues to power on after last year’s incredible run, up 13% so far in 2026), Emera continues to add steady dividends and capital gains to my portfolio.
One thing to note in regards to Power Corp (which still holds a prominent place in my TSX Dogs Portfolio after its big move last year) is that its Wealthsimple subsidiary continues to post explosive growth. While I don’t at all like the direction the company is going from a user perspective, it is undeniably finding new ways to monetize its young customer base. The company recently made waves by saying it was going to be one of the first Canadian companies to bring predictive markets (think online betting like Kalshi or Polymarket down in the States) to Canada. If casinos are a license to print money, online casinos are a license to print money right across an entire country!
Dogs of the TSX Dividend Stock Strategy Implementation
Here is the step by step procedure of how this strategy is implemented: Continue Reading…