Inflation

Inflation

Understanding Inflation, Interest Rates, and Market Reaction

Markets can be Scary but more importantly, they are Resilient

LowrieFinancial.com: Canva custom creation

By Steve Lowrie, CFA

Special to the Financial Independence Hub

Most investors understand or perhaps accept the fact that they are not able to time stock markets (sell out before they go down or buy in before they advance).

The simple rationale is that stock markets are forward looking by anticipating or “pricing in” future expectations.

While the screaming negative headlines may capture attention, stock markets are looking out to what may happen well into the future.

Timing bond markets is even harder than timing stock markets

When it comes to interest rates and inflation, my observation is that the opposite is true. Most investors seem to think they can zig or zag their bond investments ahead of interest rate changes. This is perplexing, as you can easily make the case based on evidence that trying to time bond markets is even more difficult than trying to time equity markets.

Another observation is that many investors tend to be slow to over-react. Reacting to today’s deafening headlines ignores that fact that all financial markets are extremely resilient. Whether good or bad economic news, good or bad geopolitical events, markets will work themselves out and march onto new highs, albeit sometimes punctuated by sharp and unnerving declines. Put another way, declines are temporary, whereas advances are permanent. And remember, this applies to both bond and stock markets.

It is easy to understand why we might be scared about the recent headline inflation numbers and concerned about rising interest. It is very important to keep this in context, which is what we will address today.

Interest Rates are Rising (or Falling)

With interest rates in flux, what should you do? Consider this… Continue Reading…

Bad Moon a-Risin’ — The Curious Case of Missing Inflation

By Noah Solomon

Special to Financial Independence Hub

I see the bad moon a-risin’
I see trouble on the way
I see earthquakes and lightnin’
I see bad times today

Don’t go around tonight
Well it’s bound to take your life
There’s a bad moon on the rise

  • Creedence Clearwater Revival

The Curious Case of Missing Inflation

Image by Shutterstock/Outcome

Prior to the global financial crisis of 2008, if you had asked me what would happen if the Fed and other central banks slashed rates to zero and then left them there for over a decade, I would have told you that it wouldn’t be long before the world faced a serious inflation problem. I would have been dead wrong!

The Phillips curve is an economic concept developed by A. W. Phillips that describes the relationship between inflation and unemployment. The theory holds that there is an inverse tradeoff between the two variables. All else being equal, lower unemployment leads to higher inflation, while higher unemployment is associated with lower inflation.

Phillips’ theory proved largely resilient for most of the postwar era. However, a notable exception occurred in the years following the global financial crisis (GFC). From 2009 to 2021, despite unprecedented amounts of monetary and fiscal stimulus and record low unemployment, global prices remained unexpectedly subdued.

The Evolution of the Phillips Curve

As the chart above illustrates, in the years following the GFC the Phillips curve seemed to have shifted downward. This change allowed global economies to sustain low levels of unemployment that historically would have been accompanied by runaway inflation.

The classic unemployment vs. inflation tradeoff seemed to have vanished, leaving central bankers in the enviable position of being able to leave rates at uber stimulative levels for an extended period without spurring runaway inflation. This dynamic remained in place until 2021, when the rubber of unprecedented quantities of monetary and fiscal stimulus met the road of Covid-related supply-chain disruptions. This combination brought an abrupt end to the disinflation party of the past decade, causing central banks to raise rates at a blistering pace the likes of which had not been seen since the Volcker era of the 1980s.

Declining Interest Rates: How do love thee?

The long-term effects of low inflation and record low rates on asset prices cannot be overstated. On the earnings front, low rates make it easier for consumers to borrow money for purchases, thereby increasing companies’ sales volumes and revenues. They also enhance companies’ profitability by lowering their cost of capital and making it easier for them to invest in facilities, equipment, and inventory. Lastly, higher asset prices create a virtuous cycle: they cause a wealth effect where people feel richer and more willing to spend, thereby further spurring company profits and even higher asset prices. Continue Reading…

Should you use an All-Weather portfolio?

By Mark and Joe

Special to the Financial Independence Hub

Stock market volatility can and will happen, which can really spook many investors.

To help with that, should you use an all-weather portfolio for changing market conditions?

Would an all-weather portfolio be best long-term?

How would I build an all-weather portfolio using Canadian ETFs?

Read on and find out our take, including the pros and cons of this all-weather investing approach.

The portfolio is designed for all seasons

If you prefer a more passive approach to investing, building an all-weather portfolio may be right for you. While this portfolio is designed to perform well during all seasons of the market, from an economic boom or bust and the messy stuff in between, we’ll see below that this approach is not without some flaws and drawbacks – just like any investing approach. Further, you could be missing out on some important aspects or assets for investing entirely.

Understanding how an all-weather portfolio works can help you to decide if this path could be right for you, or even if a blended all-weather approach could make much more sense.

What Is an All-Weather Portfolio?

Just as the name sounds, an all-weather portfolio is a portfolio that’s built to do well, regardless of changing market conditions.

This investing approach was popularized by Ray Dalio, a billionaire investor and founder of Bridgewater Associates, the largest hedge fund in the world. At the time of this post, Bridgewater currently manages over $140 billion in assets.

(FYI – this sounds very impressive of course, but we don’t invest in hedge funds and neither should you!)

Dalio’s all-weather philosophy is largely this:

Diversify your investments, hold specific asset classes in certain allocations, such that the portfolio can perform consistently throughout most economic conditions. 

This includes periods of increasing volatility, rising inflation, and more. More specifically, this portfolio strategy is designed to help investors ride out four specific types of events:

  1. Inflationary periods (rising prices)
  2. Deflationary periods (falling prices)
  3. Rising markets (bull/booming markets)
  4. Falling markets (bear/busting markets)

How an All-Weather Portfolio Works

Based on back-testing, essentially Dalio and his Bridgewater team came up with a model after studying the relationship between asset class performance and changing market environments. The result of this relationship crystallized the following asset class allocation that would investors to benefit whether the market is moving up or down or sideways.

Here is the asset class breakdown:


We’ll provide more detailed funds to mimic this portfolio in a bit.

One thing you’ll realize from the portfolio above is the all-weather portfolio takes a much different approach than age-based allocations (i.e., more bonds as you get older in your portfolio), the traditional 60/40 balanced portfolio, or other popular couch potato approaches. It essentially ignores an investor’s personal need for changing risk appetite. A drawback we’ll discuss more in a bit.

The theory of the All-Weather Portfolio is that:

  • The equity portion will thrive in bull markets.
  • Commodities and gold should support the portfolio for inflation.
  • Bonds will help investors when stock market growth is suffering…

You get the idea. Continue Reading…

Three ways to lower Risk in your portfolio with ETFs

Here are some of the ways ETFs can be used strategically to help you sleep better at night.

Image courtesy BMO ETFs/Getty Images

By Erin Allen, VP, Online Distribution, BMO ETFs

(Sponsor Blog)

Volatility is often seen as the price of admission for achieving investment returns, but too much of it can feel like paying a hefty fee for a ride on an intense roller coaster, only to find yourself feeling queasy by the end and unable to enjoy the rest of the amusement park.

If the recent stock market turbulence in early August has left you contemplating panic selling, take a moment to breathe. Market corrections are a normal and healthy aspect of investing, and your portfolio doesn’t have to experience such dramatic ups and downs.

Why? Well, various defensively oriented ETFs can offer strategic ways to manage and mitigate risk, helping you stay the course and remain invested through the market’s inevitable fluctuations. Here are some ideas featuring BMO ‘s ETFs lineup:

Low-volatility ETFs

Imagine the broad market, such as the S&P 500 index, as a vast sea where the waves represent market volatility, and your investment portfolio is your boat navigating these waters.

How your boat responds to these waves is dictated by its beta, a measure that indicates both the direction and magnitude of your portfolio’s fluctuations relative to the market.

To put it simply, if the market’s “waves” have a beta of 1, and your portfolio also has a beta of 1, this means your portfolio will typically move in sync with the market, rising and falling to the same degree.

Now, consider if your boat were lighter and more susceptible to the waves, symbolized by a beta of two. In this scenario, your portfolio would be expected to swing twice as much as the market: more pronounced highs and lows.

Conversely, imagine your boat is a sturdy cargo ship with a beta of 0.5. In this case, your portfolio would react more calmly to market waves, experiencing only half the ups and downs of the market. This stability is what low-beta stocks can offer, and they can be conveniently accessed through various ETFs.

One such example is the BMO Low Volatility Canadian Equity ETF (ZLB)1, which selects Canadian stocks for their low beta. Compared to the broad Canadian market, ZLB is overweight in defensive sectors like consumer staples and utilities, which are less sensitive to economic cycles.

Holding allocations are as of August 19, 2024; sourced here1.

This ETF not only offers reduced volatility and smaller peak-to-trough losses compared to the BMO S&P/TSX Composite ETF (ZCN)2 but has also managed to outperform it — demonstrating that it is very much possible to achieve more return for less risk2.

To diversify further, you can also consider low-volatility ETFs from other geographic regions. These include three; BMO Low Volatility International Equity ETF (ZLD)3, BMO Low Volatility Emerging Markets Equity ETF (ZLE)4, and the BMO Low Volatility US Equity ETF (ZLU)5.

Ultra-short-term bond ETFs

While ETFs like the ZLB1 are engineered for reduced volatility through low-beta stock selection, it’s important to remember that they still hold equities.

In extreme market downturns, such as the one experienced in March 2020 during the onset of COVID-19, these funds can still be susceptible to market risk. This is pervasive and unavoidable if you’re invested in stocks; it affects virtually all equities regardless of individual company performances.

To fortify a portfolio against such downturns, diversification into other asset classes, particularly bonds, is crucial. However, not just any bonds will do — specific types, like those held by the BMO Ultra Short-Term Bond ETF (ZST)6, are particularly beneficial in these scenarios.

ZST, which pays monthly distributions, primarily selects investment-grade corporate bonds6. The focus on high credit quality, predominantly A and BBB rated bonds, is critical for reducing risk as these ratings indicate a lower likelihood of default and thus, offer greater safety during economic uncertainties.

Moreover, ZST targets bonds with less than a year until maturity6. This short duration is pivotal for those looking to minimize interest rate risk. Short-term bonds are less sensitive to changes in interest rates compared to long-term bonds, which can experience significant price drops when rates rise.

Charts as of July 31st, 2024 6

This strategic combination of high credit quality and short maturity durations7 is why, as demonstrated in the chart below, ZST has been able to steadily appreciate in value without experiencing the same level of volatility as broader aggregate bond ETFs like the BMO Aggregate Bond ETF (ZAG)8.

Buffer ETFs

If you recall the days of using training wheels when learning to ride a bike, you’ll appreciate the concept of buffer ETFs. Just as training wheels keep you from tipping over while also limiting how fast and freely you can ride, buffer ETFs aim to moderate the range of investment outcomes — both up and down.

Buffer ETFs may sound complex, but the principle behind them is straightforward. These ETFs utilize options to limit your downside risk while also capping your potential upside returns.

For example, a buffer ETF might offer to limit your exposure to a maximum 10% price return of a reference asset (like the S&P 500 index) over a year while absorbing the first -15% of any losses during the same period.

If the reference asset rises, your investment increases alongside it, up to a 10% cap. However, if the reference asset declines, the ETF absorbs the first 15% of any loss. Only after this “downside buffer” is exhausted would you start to experience losses.

BMO offers four such buffer ETFs, each named according to the start month of their outcome period when the initial upside cap and buffer limits are set. These include: Continue Reading…

An interesting RRSP idea: all-in on QQQ?

Image courtesy Tawcan/Unsplash

By Bob Lai, Tawcan

Special to Financial Independence Hub

As an engineer by education & training and an analytical person, it shouldn’t come as a surprise to readers that I ponder a lot. I like to think about something carefully before deciding or reaching a conclusion. Although this approach may not work in all situations, I enjoy being analytical on major life decisions.

The other day I woke up with this interesting idea in my head. The idea simply wouldn’t escape from my head and I ended up thinking about it for the entire day.

The interesting idea is simple: Should we go all in on QQQ with our RRSPs?

Since this is an interesting idea, I thought I’d turn it into a blog post, analyze the idea thoroughly, and hopefully come to a conclusion.

Things to consider 

A few things before we dive into the analysis.

An RRSP is a tax-deferred account. When you contribute to one, you get a tax deduction for 100% of your contributions. If you contribute $10,000 to your RRSP, it will reduce your net income by $10,000, and potentially bring you down to the lower tax bracket.

When you withdraw money from your RRSP, you will be subject to withholding tax. The amount of withholding tax is based on how much you take out.

RRSP withholding tax
The net amount after the RRSP withholding tax is then taxed at your marginal tax rate.

You also must convert an RRSP to a retirement income option such as a RRIF by the end of the year that you turn 71. Although there are no mandatory withdrawal requirements in the year you set up your RRIF, you must start withdrawing money the year after setting up your RRIF (effectively at age 72). Furthermore, there’s a minimum withdrawal rate for RRIF. The withdrawal rate increases as you age.

Note: You can convert your RRSP before age 71. If you do, there’s a minimum withdrawal rate starting at age 55.

Just like the RRSP, money withdrawn from an RRIF is taxed like working income, or at 100% of your marginal tax rate.

In other words, it doesn’t matter whether the money is from capital gains or dividend income, money withdrawn from an RRSP and an RRIF is taxed at 100% of your marginal tax rate. You don’t get any preferential dividend tax treatment like in non-registered accounts.

When we do start living off our investments (aka live off dividends), our withdrawal strategy is very similar to Mark from My Own Advisor – NRT. This means drawing down some non-registered (N) assets along with registered assets (R), leaving TFSAs (T) for as long as possible.

More details:
  • N – Non-registered accounts – we most likely will work part-time to keep ourselves engaged and live off dividends to some degree from our non-registered accounts. The preferential dividend tax credits will come in handy.
  • R – Registered accounts (RRSPs) – we plan to make some early withdrawals from our RRSPs slowly. We may collapse our RRSPs entirely before age 71. We may also convert our RRSPs to RRIFs. This is not entirely decided (if we do convert to RRIFs, we want to make sure the dollar amount is relatively small). Early withdrawals will help us from having a large amount of money in our RRSPs and having a big tax hit when we start withdrawing. In other words, this will help smooth out our taxes.
  • T – TFSAs – since any withdrawals from TFSAs are tax-free, we intend not to touch our TFSAs for as long as possible so they can compound over time.

Mark, along with Joe (former owner of Million Dollar Journey), ran an analysis for us many years ago via their Casflows and Portfolios Retirement Projections to reinforce this withdrawal plan.

Note: if you’re interested in this retirement projections service, mention TAWCAN10 to Mark and Joe to get a 10% discount.

We may also do an RNT (Registered, Non-Registered, then TFSA) withdrawal strategy but will need to crunch some numbers. Whether it’s NRT or RNT, the important part is that we plan to slowly withdraw money from our RRSPs.

Current RRSP Holdings

Although RRSPs are best for holding U.S. dividend stocks to avoid the 15% withholding tax, we hold U.S. and Canadian dividend stocks and ETFs inside our RRSPs.

At the time of writing, we hold the following stocks and ETFs inside our RRSPs:

  • Apple (AAPL)
  • AbbVie (ABBV)
  • Amazon (AMZN)
  • Brookfield Renewable Corp (BEPC.TO)
  • BlackRock (BLK)
  • Bank of Nova Scotia (BNS.TO)
  • CIBC (CM.TO)
  • Costco (COST)
  • Emera (EMA.TO)
  • Enbridge (ENB.TO)
  • Alphabet Inc. (GOOGL)
  • Hydro One (H.TO)
  • Johnson & Johnson (JNJ)
  • Coca-Cola (KO)
  • McDonald’s (MCD)
  • Pepsi Co (PEP)
  • Procter & Gamble (PG)
  • Qualcomm (QCOM)
  • Invesco QQQ (QQQ)
  • Royal Bank (RY.TO)
  • Starbucks (SBUX)
  • Telus (T.TO)
  • Tesla (TSLA)
  • TD (TD.TO)
  • Target (TGT)
  • TC Energy Corp (TRP.TO)
  • Visa (V)
  • Waste Management (WM)
  • Walmart (WMT)
  • iShares ex-Canada international ETF (XAW.TO)
Our RRSPs consist of 18 U.S. dividend stocks, 10 Canadian dividend stocks, and 2 index ETFs.

In terms of dollar value, my RRSP makes up about 70% while Mrs. T’s RRSP (spousal RRSP) makes up about 30%. Ideally, it would be great if our RRSP breakdown were 50-50 (I’m ignoring my work’s RRSP so in reality the composition is more like a 25-75 split).

Because we started Mrs. T’s RRSP a few years later than mine it hasn’t had as much time to compound. Furthermore, I converted over $120,000 worth of CAD to USD in my RRSP when CAD was above parity. Over time, this gave my self-directed RRSP an automatic 30% performance boost.

In addition, because the exchange rate hasn’t been as attractive, the only U.S. holdings Mrs. T has are Apple and QQQ. The rest of her RRSPs are all in Canadian dividend stocks.

We purchased QQQ earlier this year inside Mrs. T’s RRSP. Dollar-wise, it makes up a very small percentage of our combined RRSPs.

Some info on QQQ

For those readers who aren’t familiar with QQQ, it’s an ETF from Invesco. Since launching in 1999, the ETF has demonstrated a history of outperformance compared to the S&P 500.

QQQ vs S&P 500

The top 11 – 20 holdings for QQQ are AMD, Netflix, PepsiCo, Adobe, Linde, Cisco, Qualcomm, T-Mobile US, Intuit, and Applied Materials. These holdings make up 15.71% of QQQ.

Due to the nature of the Nasdaq 100 Index, QQQ is heavily exposed to technology and consumer discretionary sectors.

QQQ sector allocation
As you can see from below, it also outperformed XAW and VFV significantly. This is the key attraction of QQQ, as the fund has historically outperformed many major indices.
QQQ vs XAW vs VFV performance
Source: Portfolio Visualizer

As you can see from above, $10,000 invested in QQQ in 2016 would result in over $42,000 in 2024 whereas the same amount invested in XAW and VFV would result in less than $30,000.

Case for going all-in on QQQ

Why would we consider going all in on QQQ?

Because QQQ has done very well historically compared to the major U.S. and Canadian indices.

Per the chart above, QQQ had an annualized return of 19.09% since 2016. In the last 20 years, QQQ has had an annualized return of 14.03% and an annualized return of 18.12% in the last 10 years.

Assuming we invest $150,000 in QQQ and enjoy an annualized return of 15% for the next 10 years, we’d end up with $606,833.66, assuming no additional contributions. On the flip side, if we have the same money and have an annualized return of 10% (long-term stock return), we’d end up with $389,061.37. This means investing in QQQ would result in more than $217.7k of difference in return on capital or 56%. This is a pretty significant difference.

Yes, historical returns don’t guarantee future returns. However, the high exposure to technology stocks should allow QQQ to continue the superior return for years to come.

Due to the fact that RRSP and RRIF withdrawals are taxed 100% at our marginal tax rate, it makes sense to attempt to maximize the total return inside of RRSPs/RRIFs instead of a mix of dividend income and capital return.

Case against going all in on QQQ

The biggest case against going all in on QQQ? Our dividend income would take a big hit.

Our RRSPs contribute about 30% of our annual dividend income. With our 2024 target of $55,000, selling everything in our RRSPs and holding QQQ only would reduce our total dividend income to about $38,500 (ignoring QQQ distributions completely).

But focusing on dividend income alone is a bit silly when we should be considering total return and the total portfolio value.

Out of the 18 U.S. stocks that we hold in our RRPS, QQQ holds 9 of them already. The stocks that QQQ doesn’t hold are:

  • Abby
  • Johnson & Johnson
  • Coca-Cola
  • McDonald’s
  • Procter & Gamble
  • Target
  • Visa
  • Waste Management
  • Walmart

These 9 stocks make up about 25% of our RRSP in terms of dollar value. Since we purchased these stocks many years ago, they have all done very well, with a few of them being multi-baggers. I would hate to sell the likes of Visa and Waste Management.

Investing in QQQ does mean that when we start to live off our investment portfolio, rather than withdrawing mostly from dividends inside our RRSPs in the first few years (to increase our margin of safety), we’d need to sell QQQ shares and touch our principal.

If there are a few years of poor returns at the beginning of our retirement, this could cause a significant reduction in our portfolio value. Essentially, selling shares may not have as much margin of safety compared to relying on withdrawing dividends only.

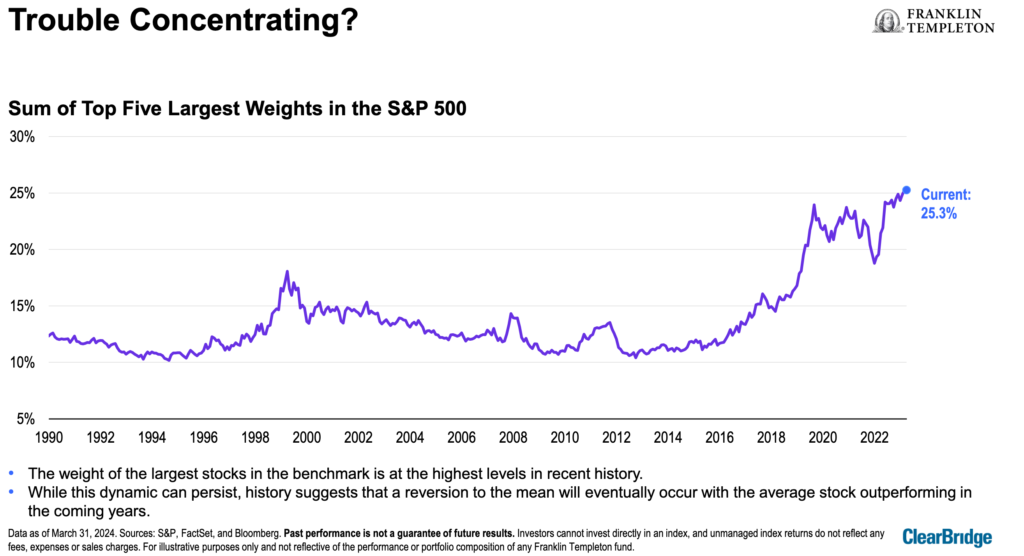
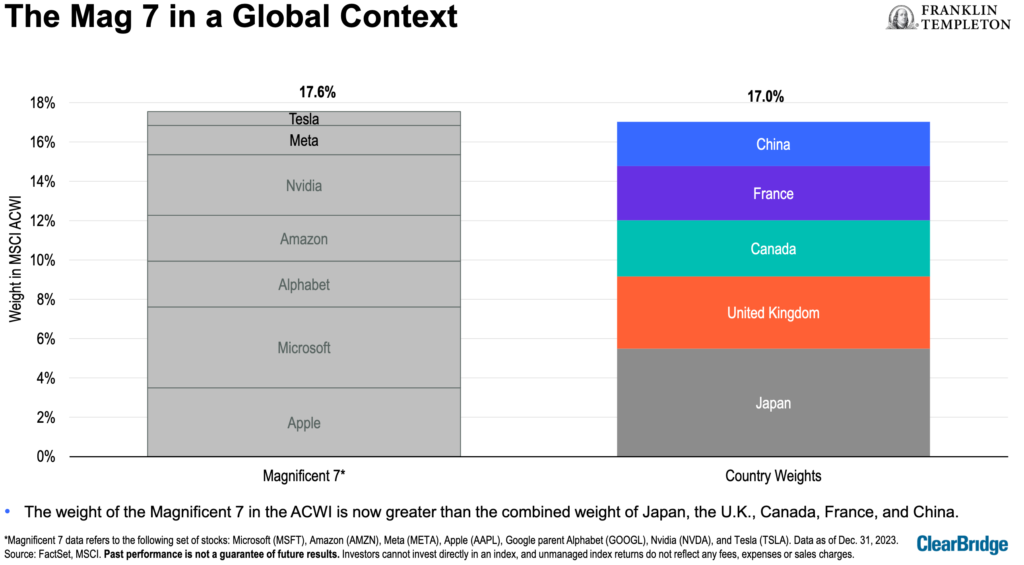
Another case against going all in on QQQ is that QQQ is currently highly concentrated in technology stocks so it’s not all that diversified compared to other index ETFs like XAW. The latest AI hype has significantly bumped up the share price of many technology stocks. Would we see a Dot Com type of bubble in the future and hamper the return of QQQ? That’s certainly possible.

QQQ historical return

As you can see from the chart above, QQQ didn’t recover from the Dot Com bubble for about 14 years. This is a risk we would take on if we were to go all in on QQQ.

Potential Alternatives to going all-in on QQQ

Instead of going all in on QQQ, there are some potential alternatives.

First, we can simply add more QQQ shares in the next few years to have QQQ make up a larger percentage of our dividend portfolio. This is already our plan of record but we stay focused on this goal instead of purchasing more dividend paying stocks in our RRSPs.

Second, since we hold QQQ inside of Mrs. T’s RRSP and she holds mostly Canadian dividend stocks in her RRSP, we can consider closing out these positions and using the money to buy QQQ shares.

If we were to do that, we’d only lose about 12% of our forward annual dividend income, going from $55,000 to $48,400. Assuming QQQ continues the superior performance over other indices, holding only QQQ and Apple in Mrs. T’s RRSP and continuing to contribute to her RRSP only may mean that we have a higher chance of ending up with a 50-50 RRSP split down the road.

Some additional logistics to consider

The second option mentioned above is quite intriguing. But there are some logistics to consider if we were to forward with this option.

Second, we’d need to convert CAD to USD and take a hit on the exchange rate. Utilizing Norbert’s Gambit would allow us to save on the additional current exchange fees. The alternative solution would be to journal as many of the holdings to the U.S. exchange, close the positions, and end up with USD.

Another option is to consider the Canadian equivalents, like XQQ, ZQQ, HXQ, or ZNQ to avoid currency conversion. As many of you know, I’m all for simplicity and straightforwardness, so it makes sense to hold the original ETF QQQ instead of other alternatives.

Conclusion – Should we go all in on QQQ? 

So, have I reached a decision after all the considerations?

I’ll admit, the second option mentioned (holding only QQQ in Mrs. T’s RRSP) is very intriguing to me. But I am going to sleep on it for a bit and discuss the idea with Mrs. T before making any major decisions. In the meantime, we will continue to add more QQQ shares in Mrs. T’s RRSP so QQQ makes up a bigger percentage of our dividend portfolio.

Readers, what would you do? Would you go all in on QQQ?

Hi there, I’m Bob from Vancouver, Canada. My wife & I started dividend investing in 2011 with the dream of living off dividends in our 40’s. Today our portfolio generates over $2,700 in dividends per month. This post originally appeared on Tawcan on July 15, 2024 and is republished on the Hub with the permission of Bob Lai.