 Last thing I remember
I was running for the door
I had to find the passage back
To the place I was before
“Relax, ” said the night man
“We are programmed to receive
You can check out any time you like
But you can never leave”
- Hotel California, by The Eagles
By Noah Solomon
Special to Financial Independence Hub
I recently met with an acquaintance who does investment due diligence and manager research for a wealth management firm. During our conversation, he told me about a bond fund which had been garnering substantial assets from investment advisors.
After the meeting, I investigated the fund. Unsurprisingly, the fund had delivered very strong returns, outpacing almost any competitor. Upon digging deeper into the fund, the saying “Not all that glitters is gold” came to mind. The fund’s portfolio consists largely of high-yielding, lower-quality, relatively illiquid corporate bonds. Notwithstanding its strong performance, I determined that the fund is not particularly attractive. As I will explain, this determination was based on the simple reason that the fund is unlikely to serve the primary function of bonds within investors’ portfolios.
Plumbers, Electricians and Bonds
In my view, the crucial function of bonds is to mitigate overall portfolio losses during equity bear markets. While some bonds have low correlations to equities and can therefore offset stock losses in bear markets, others lack this critical feature.
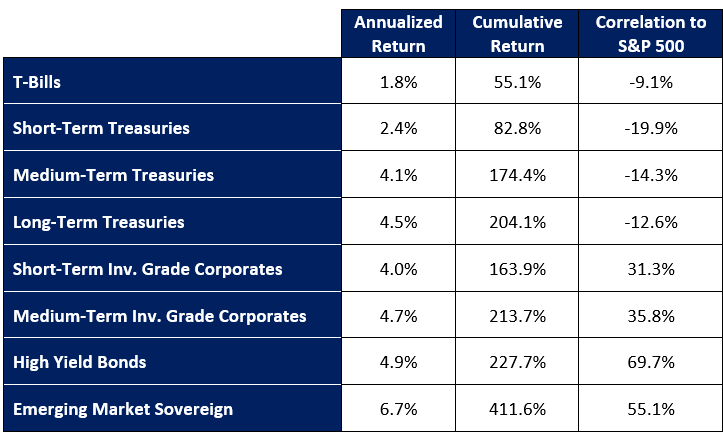
Return vs. Correlation to Stocks by Bond Type: 2000 – 2025
At one end of the spectrum, U.S. Treasury bonds tend to be least correlated to stocks. In the middle of the pack lie investment-grade corporate bonds, which tend to move in tandem with equities. At the other end of the spectrum lie high-yield and emerging-market sovereign bonds, which have the greatest correlation to stocks and thus offer no ability to serve as a shock absorber during bear markets.
Investors don’t hold bonds to achieve strong returns: stocks are much better at that, especially over longer time horizons and even more so once taxes are considered. Owning higher-return bonds that are more correlated with stocks is akin to calling an electrician to fix a plumbing issue. Not only would an electrician fail to rectify the issue, but they might even make matters worse. Similarly, not only can corporate bonds fail to diversify portfolios at critical junctures but can contribute to portfolio losses in bear markets.
Don’t get me wrong. All else being equal, higher returns are better than lower ones. Although bonds with higher correlations to stocks have delivered higher returns than those with lower correlations, this is insufficient compensation for their inability to diversify equity exposure. Bonds are first and foremost portfolio diversifiers, not return generators. If given the choice between a bond portfolio with higher returns that is more correlated to stocks and one with a lower return that is uncorrelated, I would choose the latter every time.
Corporate Bonds: A Fairweather Friend
English Poet Alfred, Lord Tennyson wrote “So vanish friendships only made in wine.” This saying can be applied to corporate bonds, which seem like a great idea in good times and anything but in tumultuous markets. When it comes to their higher returns and their ability to offset stock losses in bear markets, corporate bonds are a fairweather friend: they can abandon you in difficult times.
The correlation of corporate bonds to stocks tends to become more pronounced during times of market stress, which can result in unpleasant surprises when, rather than offsetting stock declines in bear markets, they become part of the problem. Alternatively stated, their diversification powers vanish when they are most needed. While this is the case with corporate bonds in general, it is particularly true of lower-quality high-yield bonds.
Global Financial Crisis: Performance by Bond Type
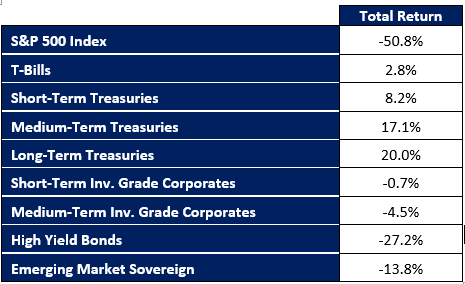
During the global financial crisis, while Treasuries of all durations provided some ballast within balanced portfolios, other segments of the bond market failed to do so, with high yield and emerging market bonds suffering substantial losses.
Forbidden Fruit and the Hotel California
There is no shortage of bond managers who strive to outperform by eating forbidden fruit, which entails holding portfolios with more credit risk and a higher correlation to stocks than their benchmark indexes.
This tactic works until it doesn’t. During “normal” markets, such managers will deliver higher returns than their benchmarks. Moreover, their higher correlation to stocks is of no concern when stock prices are rising. However, when bear markets materialize (which sooner or later they always do), their outperformance turns into underperformance. Perhaps more importantly, their higher correlations to equities render ineffective in mitigating stock losses exactly when you need them to. Rather than being a solution they become part of the problem! You might just as well own low-volatility stocks: if you’re not getting any diversification benefit you should at least reap a better after-tax return. Continue Reading…