
Flexibility without stock-picking: Sector ETFs offer diversified access to industries like tech, health care, and energy, without the need to select individual companies.
Diversification and precision: Broad ETFs provide market-wide exposure, while sector ETFs let you overweight specific industries based on your market view.
Tactical or strategic: Use sector ETFs for short-term tactical calls or long-term structural tilts (e.g., overweighting defensive sectors for cash flow).

By Michelle Allen, BMO ETFs
(Sponsor Blog)
There are many strategies investors can use in their portfolios. One of the most popular strategies is making tactical tilts with sector ETFs.
Sector ETFs – like the new BMO SPDR Select Sector Index range – allow investors to focus on the parts of the market they believe will outperform, such as health care, financials, technology, or industrials.
These ETFs make it simple to increase exposure when certain sectors are expected to perform strongly or dial it back to buffer portfolios when economic conditions change, and are available in both unhedged1 and hedged-to-CAD2 versions.
In this article, we explore how sector behaviours shift across different economic environments, and how tactical tilts using sector ETFs can help investors pursue outperformance.
What is tactical investing?
Tactical investing refers to the process of adjusting portfolio allocations in response to market conditions or economic signals.
While a long-term investor might stick to a static asset allocation, tactical investors“tilt” or increase their exposure toward sectors or asset classes that they believe are poised to outperform over shorter time frames.
Sector ETFs are ideal tools for tactical investing. They allow investors to quickly and easily overweight specific sectors without the need to pick individual stocks. At the same time, they can also be used to create more balanced portfolios as they can be used to diversify portfolios that are concentrated in certain industries.
Sector performance can change dramatically each year
Sector performance often mirrors the dynamics seen across different asset classes and individual stocks: the top performers tend to change from year to year as shown in the table below3.
Over the past five years, we’ve seen sectors like information technology, consumer discretionary, and communication services lead the market in 2020 and 2021, only to become some of the worst performers in 2022. That year saw a massive rotation into energy, a sector that had significantly lagged in 2020.
Chart 1 – S&P 500 Sector Performance
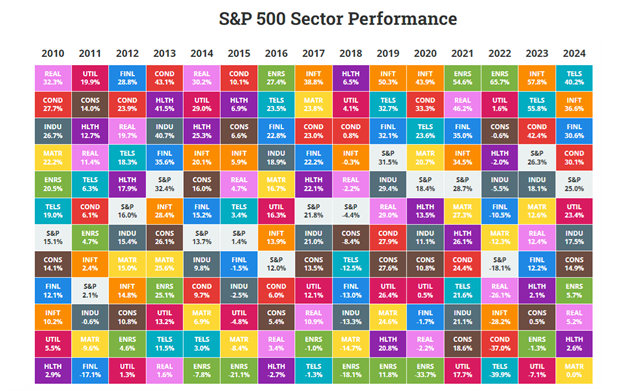
Table 1 – S&P 500 Average Sector Returns

Source: Novel Investor (as at March 31, 2025)
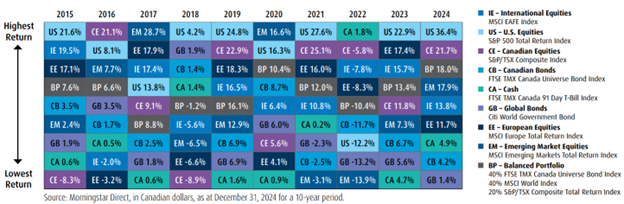
Chart 2 – Asset Class Returns
Index and sector returns do not reflect transactions costs or the deduction of other fees and expenses and it is not possible to invest directly in an Index. Past performance is not indicative of future results.
What drives these rotations? One of the key concepts is the economic cycle, which typically moves through four broad phases:
- Recession: A period of economic contraction marked by falling gross domestic product and weak demand.
- Recovery: Growth begins to rebound as consumer and business confidence, and spending, return.
- Expansion: Economic activity strengthens, employment rises, and output reaches new highs.
- Slowdown: Growth decelerates, signaling a potential shift back toward recession.
S&P 500 sector performance during phases
Understanding how sectors behave during different phases of the economic cycle is key to making informed tactical tilts. Here’s a snapshot of average S&P 500 sector performance across the four main stages of the U.S. business cycle (based on historical data from 1960-2019)4:
Table 2 – Sector Performance Across Economic Cycles
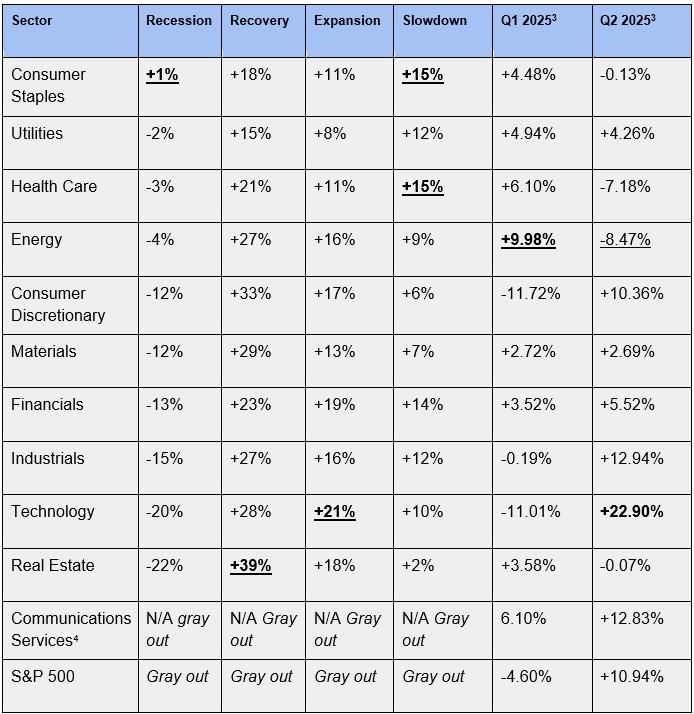
Sources: Visual Capitalist & State Street Global Advisors. Reliable averages for Communications Services unavailable during the 1960-2019 period as the sector was reorganized in September 2018.
Index and sector returns do not reflect transactions costs or the deduction of other fees and expenses and it is not possible to invest directly in an Index. Past performance is not indicative of future results.
What are the key takeaways, and what are we seeing so far in 2025?
A few general observations emerge from Table 2.
In recessions and slowdowns, defensive sectors like health care, consumer staples, and utilities tend to outperform. This is largely because demand for essentials like medicine, food, and energy remains stable regardless of economic conditions.
During recoveries, the sectors that suffered most in the prior downturn often bounce back the strongest. Real estate, for example, typically surges as lower interest rates stimulate housing demand, while consumer discretionary spending picks up as confidence returns.
In expansions, sectors like technology and financials tend to lead as they benefit from increased business investment in innovation and financials also benefit as lending activity and credit issuance expand.
It’s important to note that these are general trends, and each market environment carries its own unique dynamics.
For example, in Q1 2025, amid the complex backdrop of a trade war that could fuel a recession and drive up prices of goods, energy has so far outperformed, potentially due to attractive valuation factors. Meanwhile, defensive sectors like consumer staples, health care, and utilities delivered positive returns, softening the blow to a -4.6% drop in the S&P 500 over the period.
In Q2 2025, markets initially sold off after President Donald Trump announced reciprocal tariffs on U.S. trading partners, amplifying concerns about a potential recession. However, sentiment shifted when those tariffs were paused, and the U.S. pivoted toward striking new trade deals. As a result, markets rebounded and many of the sectors that had lagged in Q1 staged strong comebacks in Q2.
Using sector ETFs to ride economic waves
Now that we understand how sectors typically behave in different economic conditions, how can investors take advantage of these opportunities?
A good starting point is to consider S&P 500 sector weightings7, which are heavily skewed toward sectors that perform best during recoveries and expansions, like technology and consumer discretionary, but may lag during recessions.
S&P 500 Sector Allocations
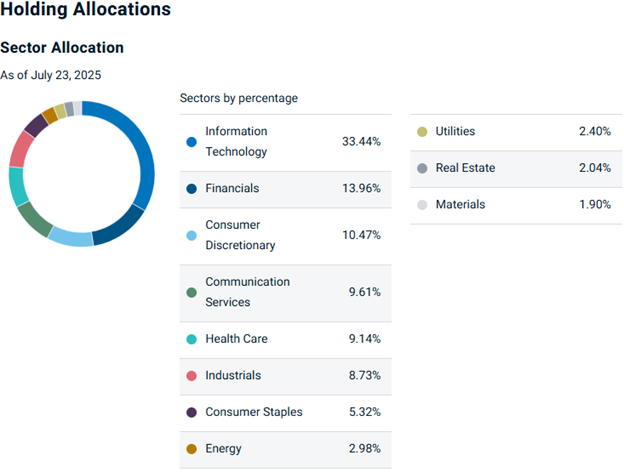
The percentage weights of each of the 11 S&P 500 sectors from largest (Information Technology 29.32%) to smallest (Materials 2.06%).
Source: BMO Global Asset Management
This is where the concept of tilting comes in: investors can dial up exposure to sectors they believe will outperform based on where we are in the economic cycle and their outlook.
Play defense: If investors anticipate a slowdown or recession, they might increase allocations to sectors that offer resilience during economic uncertainty, as demand for essentials remains steady, such as:
- BMO SPDR Consumer Staples Select Sector Index ETF (ZXLP)
- BMO SPDR Health Care Select Sector Index ETF (ZXLV), and
- BMO SPDR Utilities Select Sector Index ETF (ZXLU)
Play offense: Conversely, if investors have a more positive outlook, such as expecting tariffs to ease and interest rates to fall (BMO’s current view is two Fed cuts by December), they could overweight sectors that have been beaten down and tend to perform well during recoveries and expansions:
- BMO SPDR Real Estate Select Sector Index ETF (ZXLR)
- BMO SPDR Technology Select Sector Index ETF (ZXLK), and
- BMO SPDR Consumer Discretionary Select Sector Index ETF (ZXLY)
How much to tilt?
The standard definition of a tilt is to simply hold more of an allocation to a certain stock or sector compared to the benchmark weight, but the amount depends on each investor and their risk appetite.
Generally, a tilt is considered modest if it increases sector weightings by 2-5 percentage points above the market benchmark, and aggressive if it increases by 5-10 percentage points or more.
An illustrative example, if your portfolio is predominantly invested in the S&P 500, which comprises a nearly 30% allocation to technology, but only a 2.30% weighting to real estate, investors could choose to “tilt” their portfolios to increase their real estate weighting to 5%, which should help the portfolio outperform if predictions of a recovery come to fruition.
Once that phase of the economic cycle is completed, investors could tilt towards other sectors that do well in a recovery and expansion, with the idea being they are exceeding index returns by rotating into the right industries, at the right time.
What to watch
To be sure, making tactical calls and portfolio tilts does involve some level of market timing and requires staying on top of economic conditions.
There’s no guarantee of getting it right every time, and past sectoral performance isn’t indicative of future returns. As such, tactical tilts may not be suitable for every investor, especially those who prefer a “set and forget” approach.
That said, tilting doesn’t always have to be short-term or tactical. Investors can also take long-term strategic positions in sectors they believe will outperform or balance their portfolios based on personal goals.
For example, maintaining a higher allocation to BMO SPDR Real Estate Select Sector Index ETF (ZXLR)8 can offer diversification benefits by providing exposure to different listed properties, while boosting portfolio cash flow (given the real estate sector’s yield of ~3.24% versus 1.17% for the S&P 500).
For those interested in tactical moves, here are key indicators to watch:
- Purchasing Managers’ Index (PMI): Rising PMIs suggest economic expansion, benefiting cyclical sectors like industrials and materials.
- Interest rates/yield curve9: Higher rates often support financials, while lower rates can boost real estate and utilities.
- Consumer sentiment and retail sales: Strong data supports consumer discretionary; weak data favours consumer staples.
- Inflation expectations: Rising inflation can benefit sectors like energy and materials.
- Earnings revisions: Upward revisions may signal improving fundamentals in technology or health care.
- GDP: Rising growth signals a potential recovery, and sustained growth signals expansion, while the opposite is true when GDP turns negative or weak.
Definitions & Sources
- Unhedged: not protected against loss or failure by a counterbalancing action.
- Hedged-to-CAD: refers to a financial strategy where an investment fund, typically an ETF, is designed to protect against currency fluctuations by locking in a specific exchange rate.
- Novel Investor, Novel Investor – S&P 500 Sector Table (Q1 2025)
- Visual Capitalist, Visual Capitalist – The Top Performing S&P 500 Sectors Over the Business Cycle (2023)
- State Street Global Advisors, SPDR Sector ETF Performance Tables (Q1 2025 & Q2 2025)
- Nasdaq/Zacks, Big Tech Reshuffle & A New Fang ETF (2018)
- BMO S&P 500 Index ETF (ZSP) as of June 30, 2025
- BMO SPDR Real Estate Select Sector Index ETF (ZXLR) Inception date of Feb 3, 2025. Performance not available for funds less than one year.
- Yield curve: A line that plots the interest rates of bonds having equal credit quality but differing maturity dates. A normal or steep yield curve indicates that long-term interest rates are higher than short-term interest rates. A flat yield curve indicates that short-term rates are in line with long-term rates, whereas an inverted yield curve indicates that short-term rates are higher than long-term rates.
 Michelle Allen is a Senior Associate, Online Distribution at BMO Exchange Traded Funds. Michelle has a passion for empowering DIY investors to feel confident in their investment choices through ETF education. Michelle runs the ETF Market Insights newsletter and the Views From The Desk podcast. Michelle has an honors degree from Wilfrid Laurier University and her PMP designation.
Disclaimers
This article is for information purposes. The information contained herein is not, and should not be construed as, investment, tax or legal advice to any party. Particular investments and/or trading strategies should be evaluated relative to the individual's investment objectives and professional advice should be obtained with respect to any circumstance.

Commissions, management fees and expenses all may be associated with investments in exchange-traded funds. Please read the ETF Facts or prospectus of the BMO ETFs before investing. The indicated rates of return are the historical annual compounded total returns including changes in unit value and reinvestment of all dividends or distributions and do not take into account sales, redemption, distribution or optional charges or income taxes payable by any unitholder that would have reduced returns. Exchange-traded funds are not guaranteed, their values change frequently and past performance may not be repeated.

For a summary of the risks of an investment in the BMO ETFs, please see the specific risks set out in the BMO ETF’s prospectus. BMO ETFs trade like stocks, fluctuate in market value and may trade at a discount to their net asset value, which may increase the risk of loss. Distributions are not guaranteed and are subject to change and/or elimination.

The Index is a product of S&P Dow Jones Indices LLC or its affiliates ("SPDJI"), and has been licensed for use by the Manager. S&P®, S&P 500®, US 500, The 500, iBoxx®, iTraxx® and CDX® are trademarks of S&P Global, Inc. or its affiliates ("S&P") and Dow Jones® is a registered trademark of Dow Jones Trademark Holdings LLC ("Dow Jones"), and these trademarks have been licensed for use by SPDJI and sublicensed for certain purposes by the Manager. The ETF is not sponsored, endorsed, sold or promoted by SPDJI, Dow Jones, S&P, their respective affiliates, and none of such parties make any representation regarding the advisability of investing in such product(s) nor do they have any liability for any errors, omissions, or interruptions of the Index.

Sector ETF products are also subject to sector risk and non-diversification risk, which generally will result in greater price fluctuations than the overall market.

The Select Sector SPDR Trust consists of eleven separate investment portfolios (each a “Select Sector SPDR ETF” or an “ETF” and collectively the “Select Sector SPDR ETFs” or the “ETFs”).

Each Select Sector SPDR ETF is an “index fund” that invests in a particular sector or group of industries represented by a specified Select Sector Index. The companies included in each Select

Sector Index are selected on the basis of general industry classification from a universe of companies defined by the S&P 500®. The investment objective of each ETF is to provide

investment results that, before expenses, correspond generally to the price and yield performance of publicly traded equity securities of companies in a particular sector or group of industries, as represented by a specified market sector index.

The S&P 500, SPDRs, and Select Sector SPDRs are trademarks of The McGraw-Hill Companies, Inc. and have been licensed for use. The stocks included in each Select Sector Index were selected by the compilation agent. Their composition and weighting can be expected to differ to that in any similar indexes that are published by S&P.

The S&P 500 Index is an unmanaged index of 500 common stocks that is generally considered representative of the U.S. stock market. The index is heavily weighted toward stocks with large market capitalizations and represents approximately two-thirds of the total market value of all domestic common stocks. The S&P 500 Index figures do not reflect any fees, expenses or taxes. An investor should consider investment objectives, risks, fees and expenses before investing.

You cannot invest directly in an index.

Third Party Links and Content

This article may contain links to other sites that BMO Global Asset Management does not own or operate. Also, links to sites that BMO Global Asset Management owns or operates may be featured on third party websites on which we advertise, or in instances that we have not endorsed. Links to other websites or references to products, services or publications other than those of BMO Global Asset Management on this article do not imply the endorsement or approval of such websites, products, services or publication by BMO Global Asset Management. We do not manage, and we are not responsible for, the digital marketing and cookie practices of third parties. The linked websites have separate and independent privacy statements, notices and terms of use, which we recommend you read carefully.

Any content from or links to a third-party website are not reviewed or endorsed by us. You use any external websites or third-party content at your own risk. Accordingly, we disclaim any responsibility for them.

BMO ETFs are managed and administered by BMO Asset Management Inc., an investment fund manager and a portfolio manager, and a separate legal entity from Bank of Montreal.

BMO Global Asset Management is a brand name under which BMO Asset Management Inc. and BMO Investments Inc. operate.

“BMO (M-bar roundel symbol)” is a registered trademark of Bank of Montreal, used under licence.
