

• Gold is shining again; prices have surged to record highs this year and are forecast to climb further.
• Central banks are buying at a record pace, while investors seek protection from rising debt and currency debasement through gold ETFs.
• BMO’s gold ETF suite offers choice: ZGLD for stability, ZGD for growth, and ZJG for high-octane exposure.
Gold shines in 2025
By Erin Allen, Director, Online Distribution, BMO ETFs
(Sponsor Blog)
Gold’s reputation as an ancient store of value has rarely felt more modern.
The metal has been one of 2025’s standout performers among major asset classes, surging to record highs of around US$3,900 per ounce as of September 2025. The rally has been fueled by central bank buying, rising fiscal concerns, and investors seeking protection from a weakening U.S. dollar.
BMO Capital Markets recently lifted its gold price forecasts to an average of US$3,900 for the final quarter of 2025 and US$4,400 for 2026, reflecting what analysts describe as structural changes in the geopolitical and financial landscape¹.
The key driver: debt. With deficits in the U.S., Japan, and Europe ballooning, gold is increasingly being viewed not just as a safe haven, but as a strategic hedge against long-term currency debasement.
In this piece, we unpack what’s driving gold’s renewed strength, assess whether it’s sustainable, and outline ways investors can gain exposure through BMO ETFs from the physical metal itself to large and small-cap miners.
Central banks are quietly building reserves
One of the biggest tailwinds for gold has been record levels of central bank buying.
According to Reuters, central banks now hold 36,000 tonnes of gold, having added more than 1,000 tonnes annually for three consecutive years². This surge reflects a broad reassessment of what constitutes a safe asset.
Geopolitical instability and questions over the long-term stability of U.S. Treasuries have prompted central banks to diversify reserves. Gold has even overtaken the euro to become the second-largest global reserve asset, and for the first time since 1996, represents a larger share of reserves than Treasuries².
Chart 1: Foreign central banks hold more gold than Treasuries
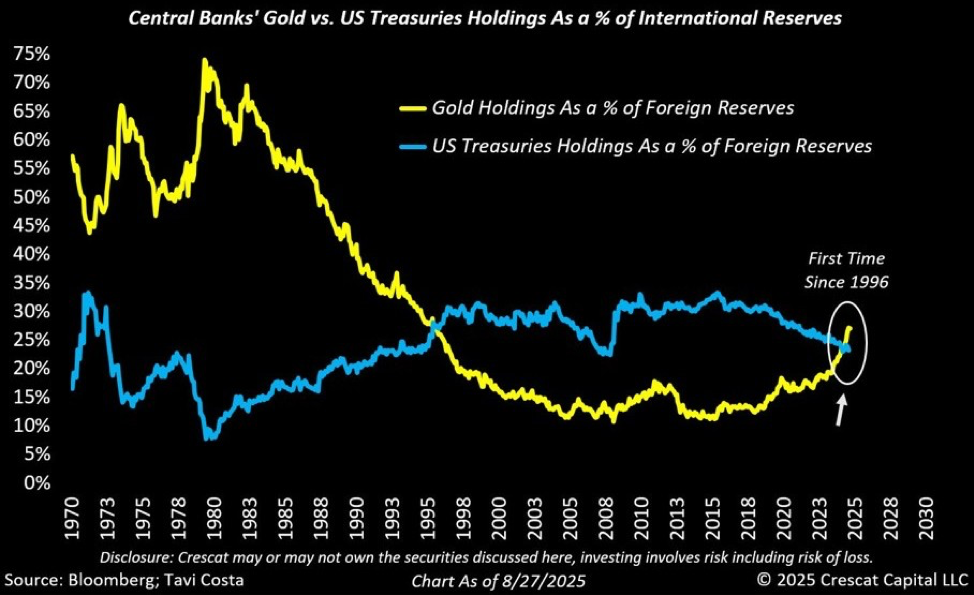
Gold fell from 75% to 15% of reserves; Treasuries rose and surpassed gold holdings around 2023 for central banks.
The World Gold Council notes that while emerging markets typically hold 5–25% of their reserves in gold, developed economies hold more than 70%³. This steady official-sector accumulation underscores the global shift to tangible assets amid growing fiscal and political uncertainty.
Trade tensions and currency debasement fears
Gold’s strength also reflects what Bloomberg calls the “debasement trade.” As government debt piles up and fiscal discipline erodes, investors are moving out of major currencies and into alternative stores of value such as gold, silver, and Bitcoin⁴.
The U.S. dollar is down roughly 8% year-to-date, while gold continues to post record highs. Bloomberg notes that the current cycle echoes previous bouts of U.S. dollar weakness following the global financial crisis and periods of aggressive monetary easing⁴.
As George Heppel, Vice President, Commodity Research at BMO Capital Markets, explains, both cyclical and structural forces are converging¹:
“What we’re really seeing this year is the combination of a short-term thesis and a long-term thesis for holding gold, which has created a perfect storm for the metal. And naturally all of this increases concerns around sticky or growing inflation and the potential for negative real rates next year, which makes gold an attractive asset to be holding as an inflation hedge,” he says.
With U.S. debt climbing and political gridlock persisting, investors have reason to question the durability of fiat currencies. Gold, with no counterparty risk and a finite supply, has reasserted its role as a monetary anchor.
According to the Congressional Budget Office (CBO), the recently passed One Big Beautiful Bill Act (OBBBA) – also known as the “Trump tax cuts” – will add an estimated US$19 trillion to U.S. debt over 30 years as written, or US$32 trillion if made permanent⁵.
“The passage of OBBBA will put tremendous pressure on the nation’s fiscal and economic health. Layered onto an already unsustainable outlook, the new law increases the risk of higher interest costs, slower growth, volatile markets, and reduced capacity to respond to future crises or invest in national priorities,” the CBO warned.
Chart 2: Debt soars under OBBBA
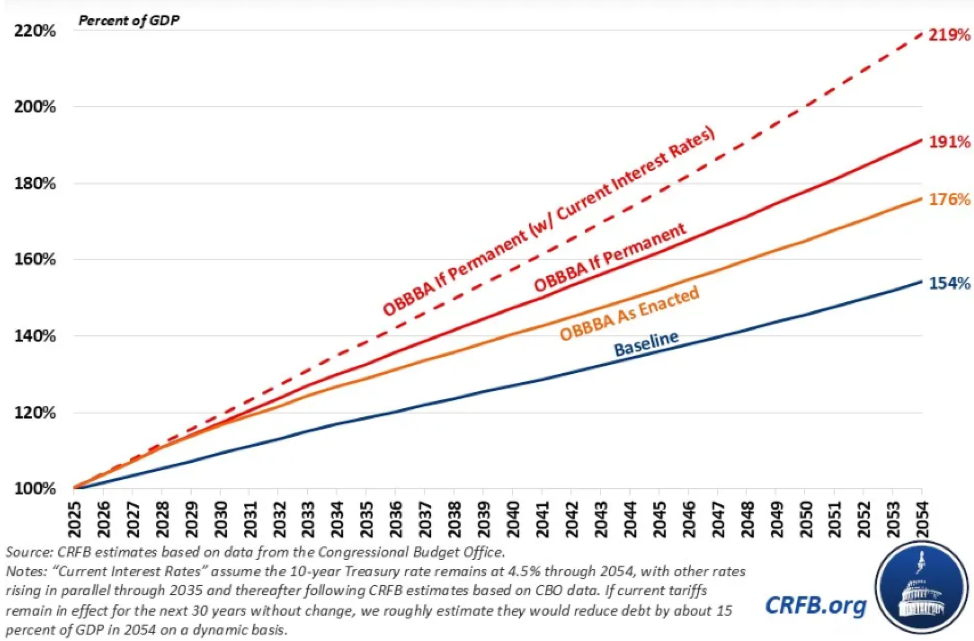
Projected U.S. debt-to-GDP rises sharply from 2025 to 2054, peaking at 219% under the highest scenario in the chart.
All logos and trademarks of other companies and/or organizations are the property of those respective companies and/or organizations.
Gold ETF demand surges to near-record levels
While central banks are leading the charge, investors are not far behind.
According to ETF.com, global gold ETFs have attracted US$44 billion in inflows this year, equivalent to roughly 443 metric tonnes of the metal⁶. That puts 2025 on track to rival the record US$49.5 billion set in 2020: the strongest year ever for gold-backed funds. Canada alone saw over $1B flow into commodity ETFs, largely driven by gold, according to National Bank of Canada’s September flows report.
Gold ETFs have become the preferred way to access gold, offering liquidity, transparency, and simplicity: all without the complications of physical storage.
Investment banks turn bullish
Institutional sentiment has followed suit.
BMO analysts believe the gold market is undergoing profound structural change, driven by debt, inflation, and de-dollarization. The bank has raised its long-term gold-price assumption to US$3,000 per ounce, up from US$2,200, placing it near the top of sell-side consensus¹.
Heppel notes that the fiscal math is increasingly untenable¹:
“Interest payments currently make up 30% of US federal revenue; that’s the highest level in decades, and given that the deficit is widening, it’s fair to assume this percentage of federal revenues will continue to grow over time if the USA doesn’t change course,” he says.
What this means is that – at some point – the Fed will need to buy government debt, monetize it, inject a huge supply of dollars into the global financial system and effectively debase the dollar, and buying gold can hedge against that.
Four ways to play gold with BMO ETFs
Gold’s resurgence has created opportunities for investors across different risk profiles and BMO’s suite of gold ETFs spans the spectrum of exposures to the metal.
ZGLD offers direct exposure to physical gold, backed by physical bullion held in secure vaults. It’s designed for investors seeking a simple, low-cost way to hold gold without dealing with the complexities of physical storage.
So far in 2025, ZGLD has appreciated about 41.7% year-to-date, mirroring the strength of the gold-price rally⁷.
Beyond its role as a hedge, studies show gold can improve risk-adjusted returns. According to a FTSE Russell and LSEG analysis dated March 31, 2025, a 60/20/20 portfolio (global equities/global bonds/gold) delivered better long-term returns with similar volatility than a traditional 60/40 stock and bond portfolio.
Table 1: Portfolio returns including and excluding gold (2010 – 2025)
| Annualized Returns | Annualized Return | Annualized Volatility | Sharpe Ratio |
| 60/40 Portfolio | 6.3% | 8.01% | 0.25% |
| 60/20/20 Portfolio | 7.5% | 8.55% | 0.38% |
Source: FTSE Russell, LSEG, as of March 31, 2025.
The findings highlight gold’s diversification benefit, due to its low correlation8 with equities and bonds and how it behaves during macro shocks.
2. BMO Equal Weight Global Gold Index ETF (ZGD):
ZGD provides diversified exposure to major global gold producers, such as Agnico Eagle, Newmont Mining and Eldorado Gold, each equally weighted to reduce concentration risk. Large-cap miners typically benefit from operating leverage: profits can rise faster than the gold price as margins expand.
ZGD has gained roughly 128.6% year-to-date, more than tripling the return of physical gold10. However, when gold prices fall, these equities tend to correct more sharply due to fixed costs and market sensitivity.
3. BMO Junior Gold Index ETF (ZJG) BMO Junior Gold Index ETF (ZJG):
ZJG targets the junior end of the mining market, including exploration and early-stage production companies with higher risk and return potential.
In 2025, ZJG has climbed about 121.0% year-to-date, underscoring its high beta11 to the gold price12. Juniors tend to lead in bull markets but underperform in downturns due to limited cash flow and their financing risk.
4. BMO Covered Call Spread Gold Bullion ETF (ZWGD)
ZWGD combines exposure to the growth in the price of gold bullion with the cash flow generated through a covered call spread strategy. This new launch from BMO Exchange Traded Funds reflects innovation in the marketplace and a way for investors to earn cash flow from a traditionally yield-less asset.
Understanding the trade-off
The stark difference in 2025 performance between bullion and gold equities highlights a key portfolio decision.
Physical gold is about capital preservation: it’s steady and defensive. Gold equities, on the other hand, offer in effect a leveraged exposure to the metal’s upside that can come with higher volatility.
Holding both can provide balance: bullion for stability, miners for growth. The right mix depends on your risk profile and investment time horizon.
Conclusion
Gold’s resurgence in 2025 reflects more than a temporary rally, it’s a structural shift driven by rising debt, fiscal instability, and renewed institutional conviction. As Heppel concludes:
“I think there’s a good probability that sovereign wealth funds and pension funds are looking at gold, judging by the fact that the 30y treasury yield keeps steadily rising after declining for decades, probably a reflection of people pricing in monetary debasement a lot more. And we’re even seeing gold being discussed as a component of institutional investment portfolios now.”
With central banks still accumulating gold, ETFs seeing an increase in inflows, and investment banks upgrading forecasts, gold’s long-term investment case looks strong.
For Canadian investors, BMO’s gold ETF suite offers investors a comprehensive toolkit to express their view on the metal.
 Erin Allen has been a part of the BMO ETFs team driving growth since the beginning, joining BMO Global Asset Management in 2010 and working her way through a variety of roles gaining experience in both sales and product development. For the past 5+ years, Ms. Allen has been working closely with capital markets desks, index providers, and portfolio managers to bring new ETFs to market. More recently, she is committed to helping empower investors to feel confident in their investment choices through ETF education. Ms. Allen hosts the weekly ETF Market Insights broadcast, delivering ETF education to DIY investors in a clear and concise manner. She has an honors degree from Laurier University and a CIM designation.
Sources
¹ BMO Capital Markets, Metal Matters: Re-Thinking the Price Deck Podcast (September 2025).
² Reuters, Gold’s rise in central bank reserves appears unstoppable (September 2025).
³ World Gold Council, Gold Reserves by Country (August 2025).
⁴ Bloomberg, Gold, Silver, Bitcoin Surge as ‘Debasement Trade’ Weighs on Dollar, Yen (August 2025).
⁵ Congressional Budget Office, 30-Year Cost of the OBBBA (September 2025).
⁶ ETF.com, Gold ETF Inflows Hit $44B in 2025, Poised to Challenge Pandemic Record (September 2025).
⁷ BMO Gold Bullion ETF (ZGLD): 41.69% as of Oct 21, 2025, 1Y 49.32%, SI 50.66%. Inception date of March 4, 2024.
⁸ Correlation: A statistical measure of how two securities move in relation to one another. Positive correlation indicates similar movements, up or down together, while negative correlation indicates opposite movements (when one rises, the other falls).
⁹ FTSE Russell, LSEG, Gold in a fragmented world: Safe haven and strategic asset (March 2025).
¹⁰ BMO Equal Weight Global Gold Index ETF (ZGD): 128.56% as of Oct 21, 2025, 1Y 122.47%, 2Y 92.24%, 3Y 59.74%, 5Y 22.98%, 10Y 22.20%, SI 9.44%. Inception date of November 14, 2012.
11 Beta: A measure of the volatility, or systematic risk, of a security or a portfolio in comparison to the market as a whole.
12 BMO Junior Gold Index ETF (ZJG): 121.00% as of Oct 21, 2025, 1Y 117.07%, 2Y 85.31%, 3Y 55.02%, 5Y 20.28%, 10Y 21.53%, SI 5.46%. Inception date of January 19, 2010.
Disclaimer

This article is for information purposes only. The information contained herein is not, and should not be construed as investment, tax or legal advice to any party. Particular investments and/or trading strategies should be evaluated relative to the individual’s investment objectives and professional advice should be obtained with respect to any circumstance.

The viewpoints expressed by the author represent their assessment of the markets at the time of publication. Those views are subject to change without notice at any time. The information provided herein does not constitute a solicitation of an offer to buy, or an offer to sell securities nor should the information be relied upon as investment advice. Past performance is no guarantee of future results.

Any statement that necessarily depends on future events may be a forward-looking statement. Forward-looking statements are not guarantees of performance. They involve risks, uncertainties and assumptions. Although such statements are based on assumptions that are believed to be reasonable, there can be no assurance that actual results will not differ materially from expectations. Investors are cautioned not to rely unduly on any forward-looking statements. In connection with any forward-looking statements, investors should carefully consider the areas of risk described in the most recent prospectus.

Commissions, management fees and expenses all may be associated with investments in exchange-traded funds. Please read the ETF Facts or prospectus of the BMO ETFs before investing. The indicated rates of return are the historical annual compounded total returns including changes in unit value and reinvestment of all dividends or distributions and do not take into account sales, redemption, distribution or optional charges or income taxes payable by any unitholder that would have reduced returns. Exchange-traded funds are not guaranteed, their values change frequently and past performance may not be repeated.

For a summary of the risks of an investment in the BMO ETFs, please see the specific risks set out in the BMO ETF’s prospectus. BMO ETFs trade like stocks, fluctuate in market value and may trade at a discount to their net asset value, which may increase the risk of loss. Distributions are not guaranteed and are subject to change and/or elimination.

BMO ETFs are managed and administered by BMO Asset Management Inc., an investment fund manager and a portfolio manager, and a separate legal entity from Bank of Montreal.

BMO Global Asset Management is a brand name under which BMO Asset Management Inc. and BMO Investments Inc. operate.

“BMO (M-bar roundel symbol)” is a registered trademark of Bank of Montreal, used under licence.
