
By Bipan Rai, Managing Director, BMO Global Asset Management
(Sponsor Blog)
The end of the year is a special time. The slowing modulation of the markets gives many an analyst time to unplug, which inevitably leads to reflection about what the next year will bring. And as ideas begin to take shape, convictions start to form and a general sense of where the market is headed is reached.
It is almost always a humbling exercise.
For instance, just consider a subset of the important macro/market events from 2025:
- The repeated rounds of tariffs and counter-tariffs between the U.S. and its largest trading partners (Canada/Mexico/China/EU).
- A massive sell-off in the spring that took the S&P 500 into bear market territory.
- The U.S. toying with the idea of raising taxes on foreign investors (Section 899).
- Inflation remaining above target across many jurisdictions for most of the year.
- Israel and Iran exchanging strikes: with the U.S. also getting involved by attacking Iranian nuclear sites.
- Repeated attacks by the U.S. president on the sitting Fed chair, with the president openly admitting that he’d like to fire the chair and replace him with someone who is more aligned to his views.
- The U.S. president attempting to remove a sitting Fed board member.
- The longest U.S. government shutdown in history.
- Market concentration remaining high with AI tiptoeing further into ‘bubble’ territory.
If, at the end of 2024, you had given us the above observations for 2025 there is little chance we would have expected U.S. equities to return 15-16% that year. We would have probably gotten the direction on gold right, but almost certainly whiffed on the magnitude of gains (at around 60%).
That is why we are going into this exercise clear-eyed and with a sense of trepidation (and maybe a bit of dread). What we can say is, given the current set-up the below trades are best positioned to serve our readers well as they look to calibrate for 2026. Please note, this is a very different exercise than our portfolio strategy (which will be out later in the new year). Instead of constructing a portfolio tailored for a particular investing approach, we are selecting ETF trades that we feel will outperform given the available information on the macro that we have on hand now.
First, some basic assumptions:
- We expect the U.S. economy to grow at trend (1.8-2.0%1) in 2026 with inflation remaining above the 2% target for the year. Additionally, the labour sector should remain under some modest pressure, which leads the Federal Reserve to cut interest rates 1-2 more times in 25 basis-point (bps) increments.
- For Canada, growth is likely to slow from this past year and settle at around 1.4-1.5%. That is still slightly below potential, which implies that inflationary pressures should remain contained. The Bank of Canada (BoC) is likely done easing for now and talks of rate hikes in late 2026 still feel premature.
- We expect the S&P 500 to rally by about 8-10% in 2026.
- We expect a consolidative environment for CAD and U.S. yields to start the year, which should give way to upside as the year progresses.
- We see downside risks to USD/CAD2 over the next three months.
With that out of the way, let’s get started.
Theme #1: Late-cycle dynamics still favour Quality …
Into 2026, we’d characterize the backdrop for the U.S. economy as one that favours resilience over cyclicality. That is not least given that the current phase of economic expansion feels a bit long in the tooth and the combination of fiscal and monetary measures might lead to an economy that runs hot (i.e., higher prices, moderate growth). In such an environment, we expect investors to prioritize companies with strong balance sheets and stable earnings: important ‘Quality’ characteristics.
Top trades for this theme:
Chart 1 – Average monthly returns for months when Core CPI is > 2%3
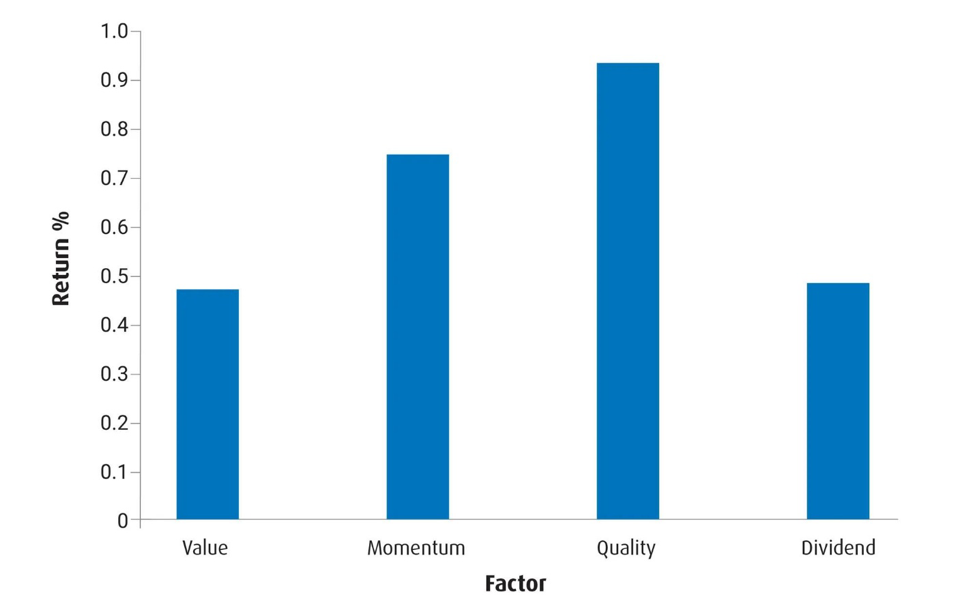 Source: BMO Global Asset Management / MSCI. For U.S. factors; observations go back by 14 years.
Theme #2: … But with broader leadership …
Much of 2025 was characterized by a migration of flows out of the U.S. and into EAFE and EM markets.4 Given the strength and stability of earnings outside of North America, we expect this theme to continue into 2026.
Aside from valuation (see Chart 2), two other catalysts for this resiliency will be the widespread adoption of new technologies in non-U.S. markets, and fiscal expansion in many countries. Both should work together to improve productivity trends outside of the U.S.
In the emerging world, we see the alignment of different themes working together to attract additional capital to these regions. Indeed, commodity exporters in Latam5 should continue to benefit from rising prices, while an improving backdrop in China should boost activity in smaller Asian markets.
Top trades for this theme:
Chart 2 – Several international markets still look cheap relative to the U.S.
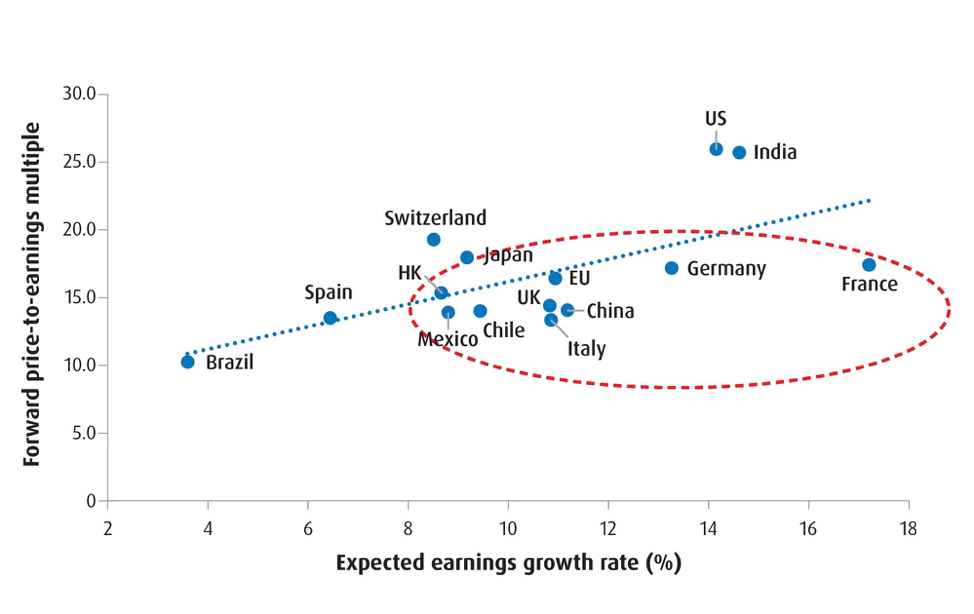 Source: BMO Global Asset Management / MSCI. A forward price-to-earnings ratio (Fwd P/E) is a stock valuation metric that compares a company or stock index’s current share value to estimated future earnings over the next 12 months.
Theme #3: … And a rotation away from AI
The delicate rotation away from AI/Tech and into other sectors should continue and will likely engender further uncertainty. However, greater adoption of technology outside of Tech/Communications sectors will likely shift capital over to cheaper segments of the U.S. market.
Within the Tech/Communications sectors, we feel active strategies will be better placed to perform. That is largely because the market will become judicious about picking winners and losers in the AI race as increased reliance on debt financing will mean that existing capital structures are more heavily scrutinized. That should portend a more consolidative environment for broad tech: which supports a product like ZWT, given its generous yield.
Outside of tech, two sectors that we feel are best positioned are U.S. Health Care and Financials. In particular, Health Care has emerged as an effective hedge against AI-related concerns. The sector is still a bit ‘cheap’ as well, which has also worked to support its performance over the past months.
For Financials, we expect demand for loans in the U.S. economy to remain strong: not least as household balance sheets remain in good standing and as valuations remain cheap when compared to other sectors. An additional tailwind comes from regulatory changes that should free up more capital for deployment.
Top trades for this theme:
- BMO Covered Call Technology ETF (Ticker: ZWT)
- BMO SPDR Health Care Select Sector Index ETF (Ticker: ZXLV)
- BMO SPDR Financials Select Sector Index ETF (Ticker: ZXLF)
Theme #4: Elbows up!
In Canada, we remain constructive on Financials but also acknowledge that the market is likely to be one in which alpha6 can be generated through more active strategies.
Indeed, we continue to like Canadian banks. Strong capital positions and the ability to generate revenues outside of traditional retail-based lending means there are plenty of opportunities for capital deployment in 2026. However, valuation remains a bit of a headwind. As such, we favour a covered call strategy instead of a beta7 one.
More broadly, without the benefit of a banner year for gold again, we see increased risks for a more volatile market backdrop. Upcoming CUSMA (Canada United States Mexico Agreement) “2.0” talks will bring some chops to the Canadian asset space, which implies there is an opportunity for active ETFs to outperform broad market beta plays.
Top trades for this theme:
Chart 3 – Canadian bank valuations are high relative to history
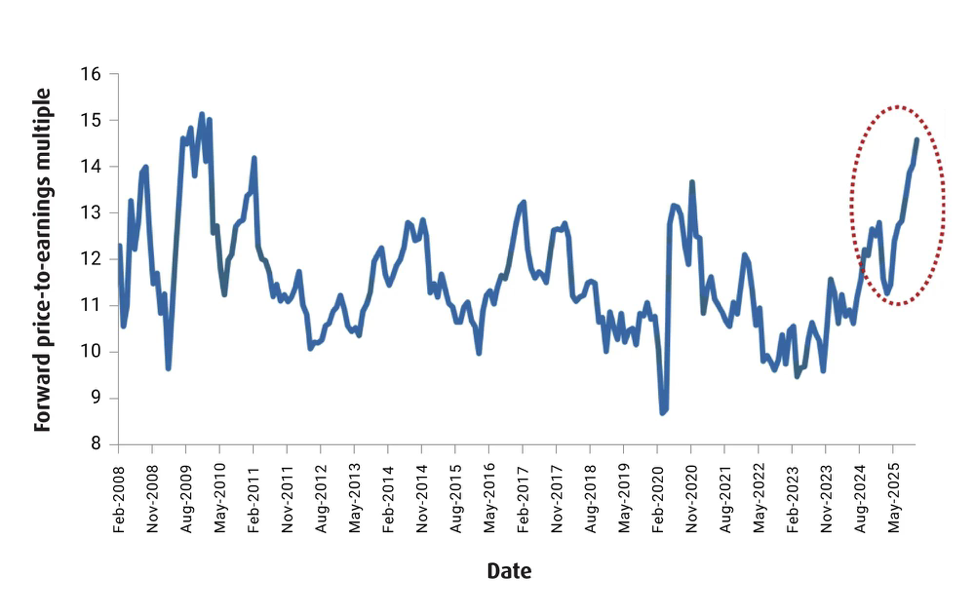 Source: BMO Global Asset Management /Bloomberg.
Theme #5: Float over fixed
The setup for fixed income looks suboptimal across most markets next year. Indeed, with central banks in most of the developed world at the end of their respective easing cycles and with term premiums8 in several countries expected to increase, the risk is skewed towards higher yields in many markets (including Canada and Japan) as the year progresses.
In places where central banks are expected to ease further (the U.S. and U.K.), markets have already moved to price terminal rates9 close to neutral. For additional cuts to happen, economic conditions would have to deteriorate further, which would necessitate shifts into stimulative policy. That is something we don’t envisage happening at this point.
Indeed, with stickier inflation and rising term premium risks, we prefer sub-sovereign floating rate issues to fixed rates in the fixed-income sleeve of our portfolios.
Top trades for this theme:
Theme #6: Stay with gold, but don’t expect the moon again
Sorry folks, we aren’t likely to see the price of gold rally by over 60% again in 2026.
Indeed, we expect that demand for jewellery fabrication (which accounts for over 50% of demand in a typical year) will decline, leading to a build in inventories. That will mean retail/institutional investors (who carried the load in 2025) and central banks (10%) will have to pick up some of the slack.
To be fair, that could happen with inflation set to remain an issue for several central banks. However, that profiles to about a 0-5% pick-up in price appreciation. As such, we like the idea of utilizing the covered call spread strategy10 for gold to juice returns by an additional 5%.
Top trades for this theme:
Theme #7: Infrastructure: So what if it’s boring!
Exposure to global infrastructure funds will give investors access to long-duration revenues that are dependent on inelastic demand. What’s more is that there is a strong need for infrastructure in the developed world (mainly upgrades and the push for electrification) and in the emerging world (due to changing demographics).
Top trades for this theme:
Theme #8: Hedge your FX risks into the start of the year
As a rule, we generally abstain from providing actionable foreign exchange (FX) ideas that last longer than three months: the reason being that long-term currency risks are generally not rewarded by the market. Indeed, the best practice is to remain nimble and to adjust your exposures frequently.
Into the start of 2026, we’re short USD/CAD: which means we expect the U.S. dollar to weaken relative to the loonie over the next three months. This is primarily because we see increased risks that the BoC is likely done easing for this cycle while the Fed may be underestimating the degree of softness in the U.S. labour market and elect to cut a few times next year. Additionally, the market is incredibly short the loonie right now (as gauged by net non-commercial positioning in FX futures). That makes us a bit more doubtful about the prospects of additional CAD weakness from here.
Performance
| Ticker | Year-to-date | 1-month | 3-month | 6-month | 1-year | 3-year | 5-year | 10-year | Since inception | Inception date |
| ZEA | 24.00% | 0.36% | 5.57% | 10.65% | 23.57% | 16.50% | 10.74% | 8.09% | 8.37% | 2014-02-10 |
| ZWB | 28.90% | 4.00% | 11.49% | 23.52% | 27.69% | 15.66% | 14.43% | 10.66% | 9.90% | 2011-01-28 |
| ZEM | 27.61% | -2.37% | 10.95% | 22.99% | 28.73% | 15.23% | 6.27% | 8.05% | 5.92% | 2009-10-20 |
| ZUQ | 12.27% | 1.37% | 9.16% | 16.35% | 11.57% | 23.89% | 15.95% | 15.65% | 16.69% | 2014-11-05 |
| ZFH | 6.33% | 0.61% | 2.15% | 4.77% | 6.28% | 10.15% | 7.05% | 5.82% | 5.37% | 2014-02-10 |
| ZWT | 20.80% | -2.28% | 11.80% | 27.03% | 26.69% | 40.42% | — | — | 21.25% | 2021-01-20 |
| ZLSC | 20.00% | 1.88% | 5.97% | 12.10% | 17.99% | — | — | — | 21.23% | 2023-09-27 |
| ZAAA | Returns are not available as there is less than one year’s performance data. | 2025-04-30 | ||||||||
| ZWGD | Returns are not available as there is less than one year’s performance data. | 2025-05-22 | ||||||||
| ZXLV | Returns are not available as there is less than one year’s performance data. | 2025-02-04 | ||||||||
| ZXLF | Returns are not available as there is less than one year’s performance data. | 2025-02-04 | ||||||||
| BGIF | 18.24% | 2.67% | 6.17% | 9.05% | 14.50% | — | — | — | 17.95% | 2023-06-27 |
| Bloomberg, as of November 28, 2025. |
Source
1Gross Domestic Product (GDP) is the total monetary value of all final goods and services produced within a country’s borders in a specific time period, serving as the main measure of a nation’s economic size.
2USD/CAD is shorthand for the U.S. dollar compared to the Canadian dollar.
3Core CPI (Consumer Price Index) is a key inflation gauge that strips out volatile food and energy prices from the overall CPI, offering a clearer picture of underlying inflation trends.
4EAFE stands for developed markets in Europe, Australasia, and the Far East. EM refers to ‘emerging markets’, and includes major economies and many smaller countries such as China, India, Brazil, South Korea, Taiwan, and South Africa.
5Latin America (Mexico, Central America, South America, and parts of the Caribbean).
6Alpha: a measure of an investment’s excess return compared to its expected return, adjusted for risk (beta),
7Beta: a measure of an investment’s volatility or risk relative to the overall market. A “beta” investment indicates it is expected to move in tandem with the overall market.
8Term premium: the extra return (a risk premium) investors demand for holding a longer-term bond instead of repeatedly reinvesting in shorter-term bonds over the same period, compensating for risks like uncertain inflation and interest rate changes.
9Terminal rate: usually refers to a central bank’sinterest rate at the end of a policy cycle, a long-term, ‘neutral’ rate that balances growth and stable inflation.
10A covered call strategy involves an investor who owns shares of stock simultaneously selling (writing) call options on that same stock, generating immediate income (premium) while agreeing to sell their shares at a set price (strike price).

Bipan Rai is Head of ETF and Structured Solutions Strategy, Exchange Traded Funds
for BMO Global Asset Management. Bipan joined BMO Global Asset Management in 2024 and currently serves as Head of ETF Strategy, delivering strategic research for the ETF and Structured Solutions team. He is highly regarded for his macroeconomic insights as well as his knowledge of market structure for various asset classes. His focus is on fundamental macro research and the implications for the ETF market place, including economic, monetary and fiscal policy analysis alongside developments in funding and liquidity. Prior to joining BMO GAM, Bipan spent 13 years as a top-ranked strategist at a large Canadian dealer. He has won several awards for his research from various publications (Greenwich Survey, Bloomberg) and is a regular contributor to global business media outlets (BNN/Bloomberg, CNBC, WSJ). He holds an MBA from the Schulich School of Business at York University and a Bachelor of Engineering degree (Aerospace Engineering) from Toronto Metropolitan University.
Disclaimers

This article is for information purposes only. The information contained herein is not, and should not be construed as investment, tax or legal advice to any party. Particular investments and/or trading strategies should be evaluated relative to the individual’s investment objectives and professional advice should be obtained with respect to any circumstance.

The viewpoints expressed by the author represent their assessment of the markets at the time of publication. Those views are subject to change without notice at any time. The information provided herein does not constitute a solicitation of an offer to buy, or an offer to sell securities nor should the information be relied upon as investment advice. Past performance is no guarantee of future results. This communication is intended for informational purposes only.

Any statement that necessarily depends on future events may be a forward-looking statement. Forward-looking statements are not guarantees of performance. They involve risks, uncertainties and assumptions. Although such statements are based on assumptions that are believed to be reasonable, there can be no assurance that actual results will not differ materially from expectations. Investors are cautioned not to rely unduly on any forward-looking statements. In connection with any forward-looking statements, investors should carefully consider the areas of risk described in the most recent prospectus.

Commissions, management fees and expenses all may be associated with investments in exchange-traded funds. Please read the ETF Facts or prospectus of the BMO ETFs before investing. The indicated rates of return are the historical annual compounded total returns including changes in unit value and reinvestment of all dividends or distributions and do not take into account sales, redemption, distribution or optional charges or income taxes payable by any unitholder that would have reduced returns. Exchange-traded funds are not guaranteed, their values change frequently and past performance may not be repeated.

For a summary of the risks of an investment in the BMO ETFs, please see the specific risks set out in the BMO ETF’s prospectus. BMO ETFs trade like stocks, fluctuate in market value and may trade at a discount to their net asset value, which may increase the risk of loss. Distributions are not guaranteed and are subject to change and/or elimination.

BMO ETFs are managed and administered by BMO Asset Management Inc., an investment fund manager and a portfolio manager, and a separate legal entity from Bank of Montreal.

Distribution yields are calculated by using the most recent regular distribution, or expected distribution, (which may be based on income, dividends, return of capital, and option premiums, as applicable) and excluding additional year end distributions, and special reinvested distributions annualized for frequency, divided by current net asset value (NAV). The yield calculation does not include reinvested distributions.

Distributions are not guaranteed, may fluctuate and are subject to change and/or elimination. Distribution rates may change without notice (up or down) depending on market conditions and NAV fluctuations.

The payment of distributions should not be confused with the BMO ETF’s performance, rate of return or yield. If distributions paid by a BMO ETF are greater than the performance of the investment fund, your original investment will shrink. Distributions paid as a result of capital gains realized by a BMO ETF, and income and dividends earned by a BMO ETF, are taxable in your hands in the year they are paid.

Your adjusted cost base will be reduced by the amount of any returns of capital. If your adjusted cost base goes below zero, you will have to pay capital gains tax on the amount below zero.

Cash distributions, if any, on units of a BMO ETF (other than accumulating units or units subject to a distribution reinvestment plan) are expected to be paid primarily out of dividends or distributions, and other income or gains, received by the BMO ETF less the expenses of the BMO ETF, but may also consist of non-taxable amounts including returns of capital, which may be paid in the manager’s sole discretion. To the extent that the expenses of a BMO ETF exceed the income generated by such BMO ETF in any given month, quarter, or year, as the case may be, it is not expected that a monthly, quarterly, or annual distribution will be paid. Distributions, if any, in respect of the accumulating units of BMO Short Corporate Bond Index ETF, BMO Short Federal Bond Index ETF, BMO Short Provincial Bond Index ETF, BMO Ultra Short-Term Bond ETF and BMO Ultra Short-Term US Bond ETF will be automatically reinvested in additional accumulating units of the applicable BMO ETF. Following each distribution, the number of accumulating units of the applicable BMO ETF will be immediately consolidated so that the number of outstanding accumulating units of the applicable BMO ETF will be the same as the number of outstanding accumulating units before the distribution. Non-resident unitholders may have the number of securities reduced due to withholding tax. Certain BMO ETFs have adopted a distribution reinvestment plan, which provides that a unitholder may elect to automatically reinvest all cash distributions paid on units held by that unitholder in additional units of the applicable BMO ETF in accordance with the terms of the distribution reinvestment plan. For further information, see the distribution policy in the BMO ETFs’ prospectus.

The ETF referred to herein is not sponsored, endorsed, or promoted by MSCI and MSCI bears no liability with respect to the ETF or any index on which such ETF is based. The ETF’s prospectus contains a more detailed description of the limited relationship MSCI has with the Manager and any related ETF.

CLOs are floating- or fixed-rate debt securities issued in different tranches, with varying degrees of risk, by trusts or other special purpose vehicles (“CLO Issuers”) and backed by an underlying portfolio consisting primarily of below investment grade corporate loans. The BMO ETF pursues its investment objective by investing, under normal circumstances, at least 85% of its net assets in CLOs that, at the time of purchase, are rated AAA or the equivalent by a nationally recognized statistical rating organization.

AAA herein refers to the order of payments, should there be any defaults, and does not represent the ratings of the underlying loans within the CLO. If there are loan defaults or the CLO Issuer’s collateral otherwise underperforms, scheduled payments to senior tranches take precedence over those of mezzanine tranches (a tranche or tranches subordinated to the senior tranche), and scheduled payments to mezzanine tranches take precedence over those to subordinated/equity tranches. The riskiest portion is the “Equity” tranche, which bears the first losses and is expected to bear all or the bulk of defaults from the corporate loans held by the CLO Issuer serves to protect the other, more senior tranches from default.

The Index is a product of S&P Dow Jones Indices LLC or its affiliates (“SPDJI”), and has been licensed for use by the Manager. S&P®, S&P 500®, US 500, The 500, iBoxx®, iTraxx® and CDX® are trademarks of S&P Global, Inc. or its affiliates (“S&P”) and Dow Jones® is a registered trademark of Dow Jones Trademark Holdings LLC (“Dow Jones”), and these trademarks have been licensed for use by SPDJI and sublicensed for certain purposes by the Manager. The ETF is not sponsored, endorsed, sold or promoted by SPDJI, Dow Jones, S&P, their respective affiliates, and none of such parties make any representation regarding the advisability of investing in such product(s) nor do they have any liability for any errors, omissions, or interruptions of the Index.

The Select Sector SPDR Trust consists of eleven separate investment portfolios (each a “Select Sector SPDR ETF” or an “ETF” and collectively the “Select Sector SPDR ETFs” or the “ETFs”). Each Select Sector SPDR ETF is an “index fund” that invests in a particular sector or group of industries represented by a specified Select Sector Index. The companies included in each Select Sector Index are selected on the basis of general industry classification from a universe of companies defined by the S&P 500®. The investment objective of each ETF is to provide investment results that, before expenses, correspond generally to the price and yield performance of publicly traded equity securities of companies in a particular sector or group of industries, as represented by a specified market sector index.

The S&P 500, SPDRs, and Select Sector SPDRs are trademarks of The McGraw-Hill Companies, Inc. and have been licensed for use. The stocks included in each Select Sector Index were selected by the compilation agent. Their composition and weighting can be expected to differ to that in any similar indexes that are published by S&P.

The S&P 500 Index is an unmanaged index of 500 common stocks that is generally considered representative of the U.S. stock market. The index is heavily weighted toward stocks with large market capitalizations and represents approximately two-thirds of the total market value of all domestic common stocks. The S&P 500 Index figures do not reflect any fees, expenses or taxes. An investor should consider investment objectives, risks, fees and expenses before investing.

You cannot invest directly in an index.

“BMO (M-bar roundel symbol)” is a registered trademark of Bank of Montreal, used under licence.
