

 Posted By

By Hamilton ETFs
(Sponsor Blog)
In May 2020, during the early days of the pandemic and while bank stocks were depressed, we presented a webcast entitled “Credit Cycle is Coming – What to Expect.”
During that webcast, we (correctly) predicted that during the expected downturn, the new loan loss accounting would deepen the credit cycle for the Canadian banks and importantly shorten its duration to 2-3 quarters (versus the historical duration of a credit cycle of 4-6 quarters).
Two quarters later, in October, we followed up with a presentation/webcast entitled “Canadian Banks: Cycle is (Basically) Over,” explaining why we believed the cycle was ending, and that the upside from earnings normalization was material.
Demonstrating our conviction, we launched HCAL: the Hamilton Enhanced Canadian Bank ETF, Canada’s first modestly levered ETF on October 14, 2020. We argued that its higher yield and growth potential relative to the Canadian banks created an excellent opportunity for long-term investors to take advantage of the looming recovery. We also noted that notwithstanding its modest leverage of 25%, its volatility profile was not meaningfully different than owning an individual Canadian bank stock[1].
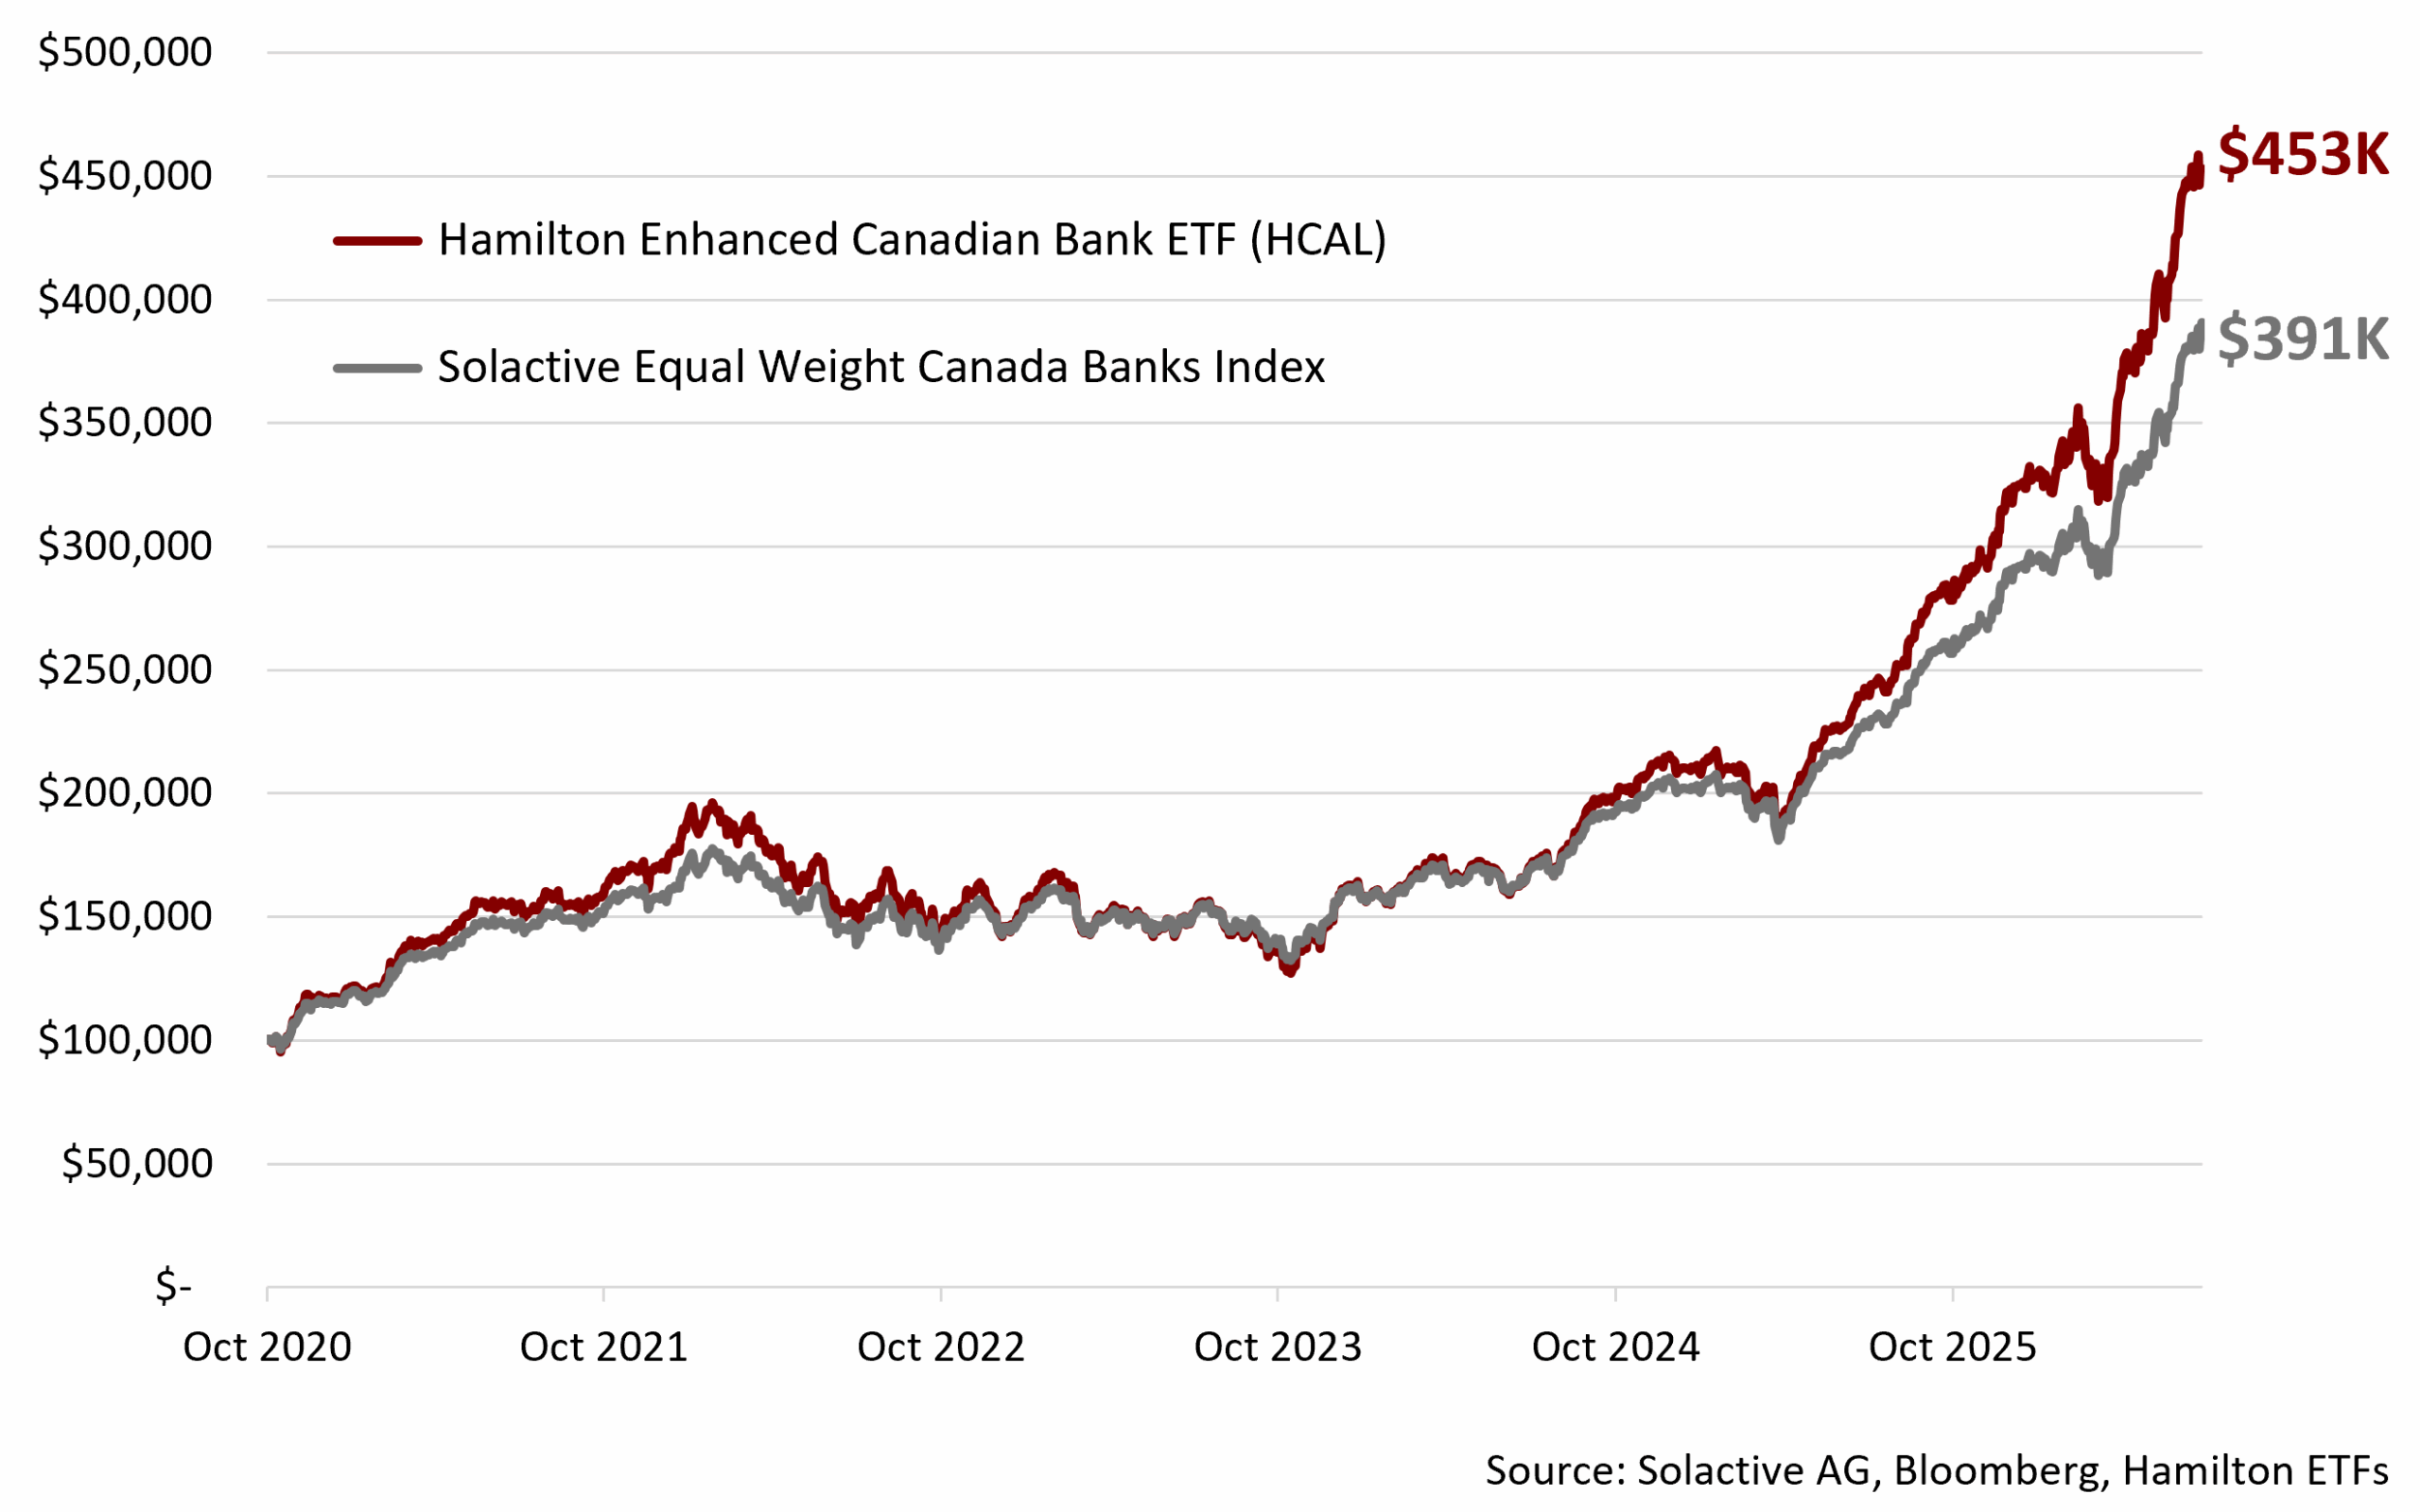
In the year that followed, Canada’s Big Six bank stocks recovered much faster than the market anticipated, due to an improving macro environment and rapid normalization of earnings supported by large reserve releases. In 2021, HCAL rose more than 51%, outperforming the Solactive Equal Weight Canada Banks Index by over 20%[2].
HCAL’s success marked an important milestone in our growth and helped pioneer a new category in Canada, demonstrating that modest leverage, when applied thoughtfully to high-quality stocks and trusted sectors, could enhance long-term returns.
Since inception, HCAL has generated an annualized return to investors of 30.3%, with a higher yield and similar volatility profile to the Big Six Canadian banks (more below).
As a result, HCAL now has over $1 billion in assets under management (AUM), making it the seventh member of the Hamilton $1 billion-and-over club.
In Canada, Banking is King
Known for their consistent dividends and wide ownership, Canada’s Big Six banks are considered among the most reliable blue-chip companies in the country and the backbone of the economy and stock market.
Put simply, for every $100 you invest, you get approximately $125 exposure (net of financing costs), and this approach has delivered higher monthly income and higher long-term returns since HCAL’s inception when compared to the Canadian bank index, specifically the Solactive Equal Weight Canada Banks Index (“Canadian Bank Index”.)
HCAL vs. Canadian Bank Index — Growth of $100K[3]
A Symbol of Hamilton Innovation and Rigour
Born out of inventive thinking during a time of uncertainty for the banking sector, HCAL has grown to more than $1 billion in assets under management and become an important part of Hamilton ETFs’ growth and story. Its success reflects our focus on developing thoughtful, differentiated investment solutions, which is key to the Hamilton ETFs ethos.
“As an ETF provider, you want to offer products that make your clients money, it can’t just be about inflows to you. We always ask: is this a good product? Does it add value and choice to investors?” said Executive Chairman and Co-Founder Robert Wessel.
Some of the factors that have made HCAL stand out:
- Owning blue-chip Canadian banks: HCAL provides exposure to the Canadian banks, one of Canada’s most trusted sectors with an uncommonly long record of dividend sustainability.
- Modest leverage/enhanced structure: HCAL borrows 25% at institutional borrowing rates and invests approximately 125% in the HAMILTON CHAMPIONS™ Canadian Bank Equal-Weight Index (HEB), which owns the Big Six banks.
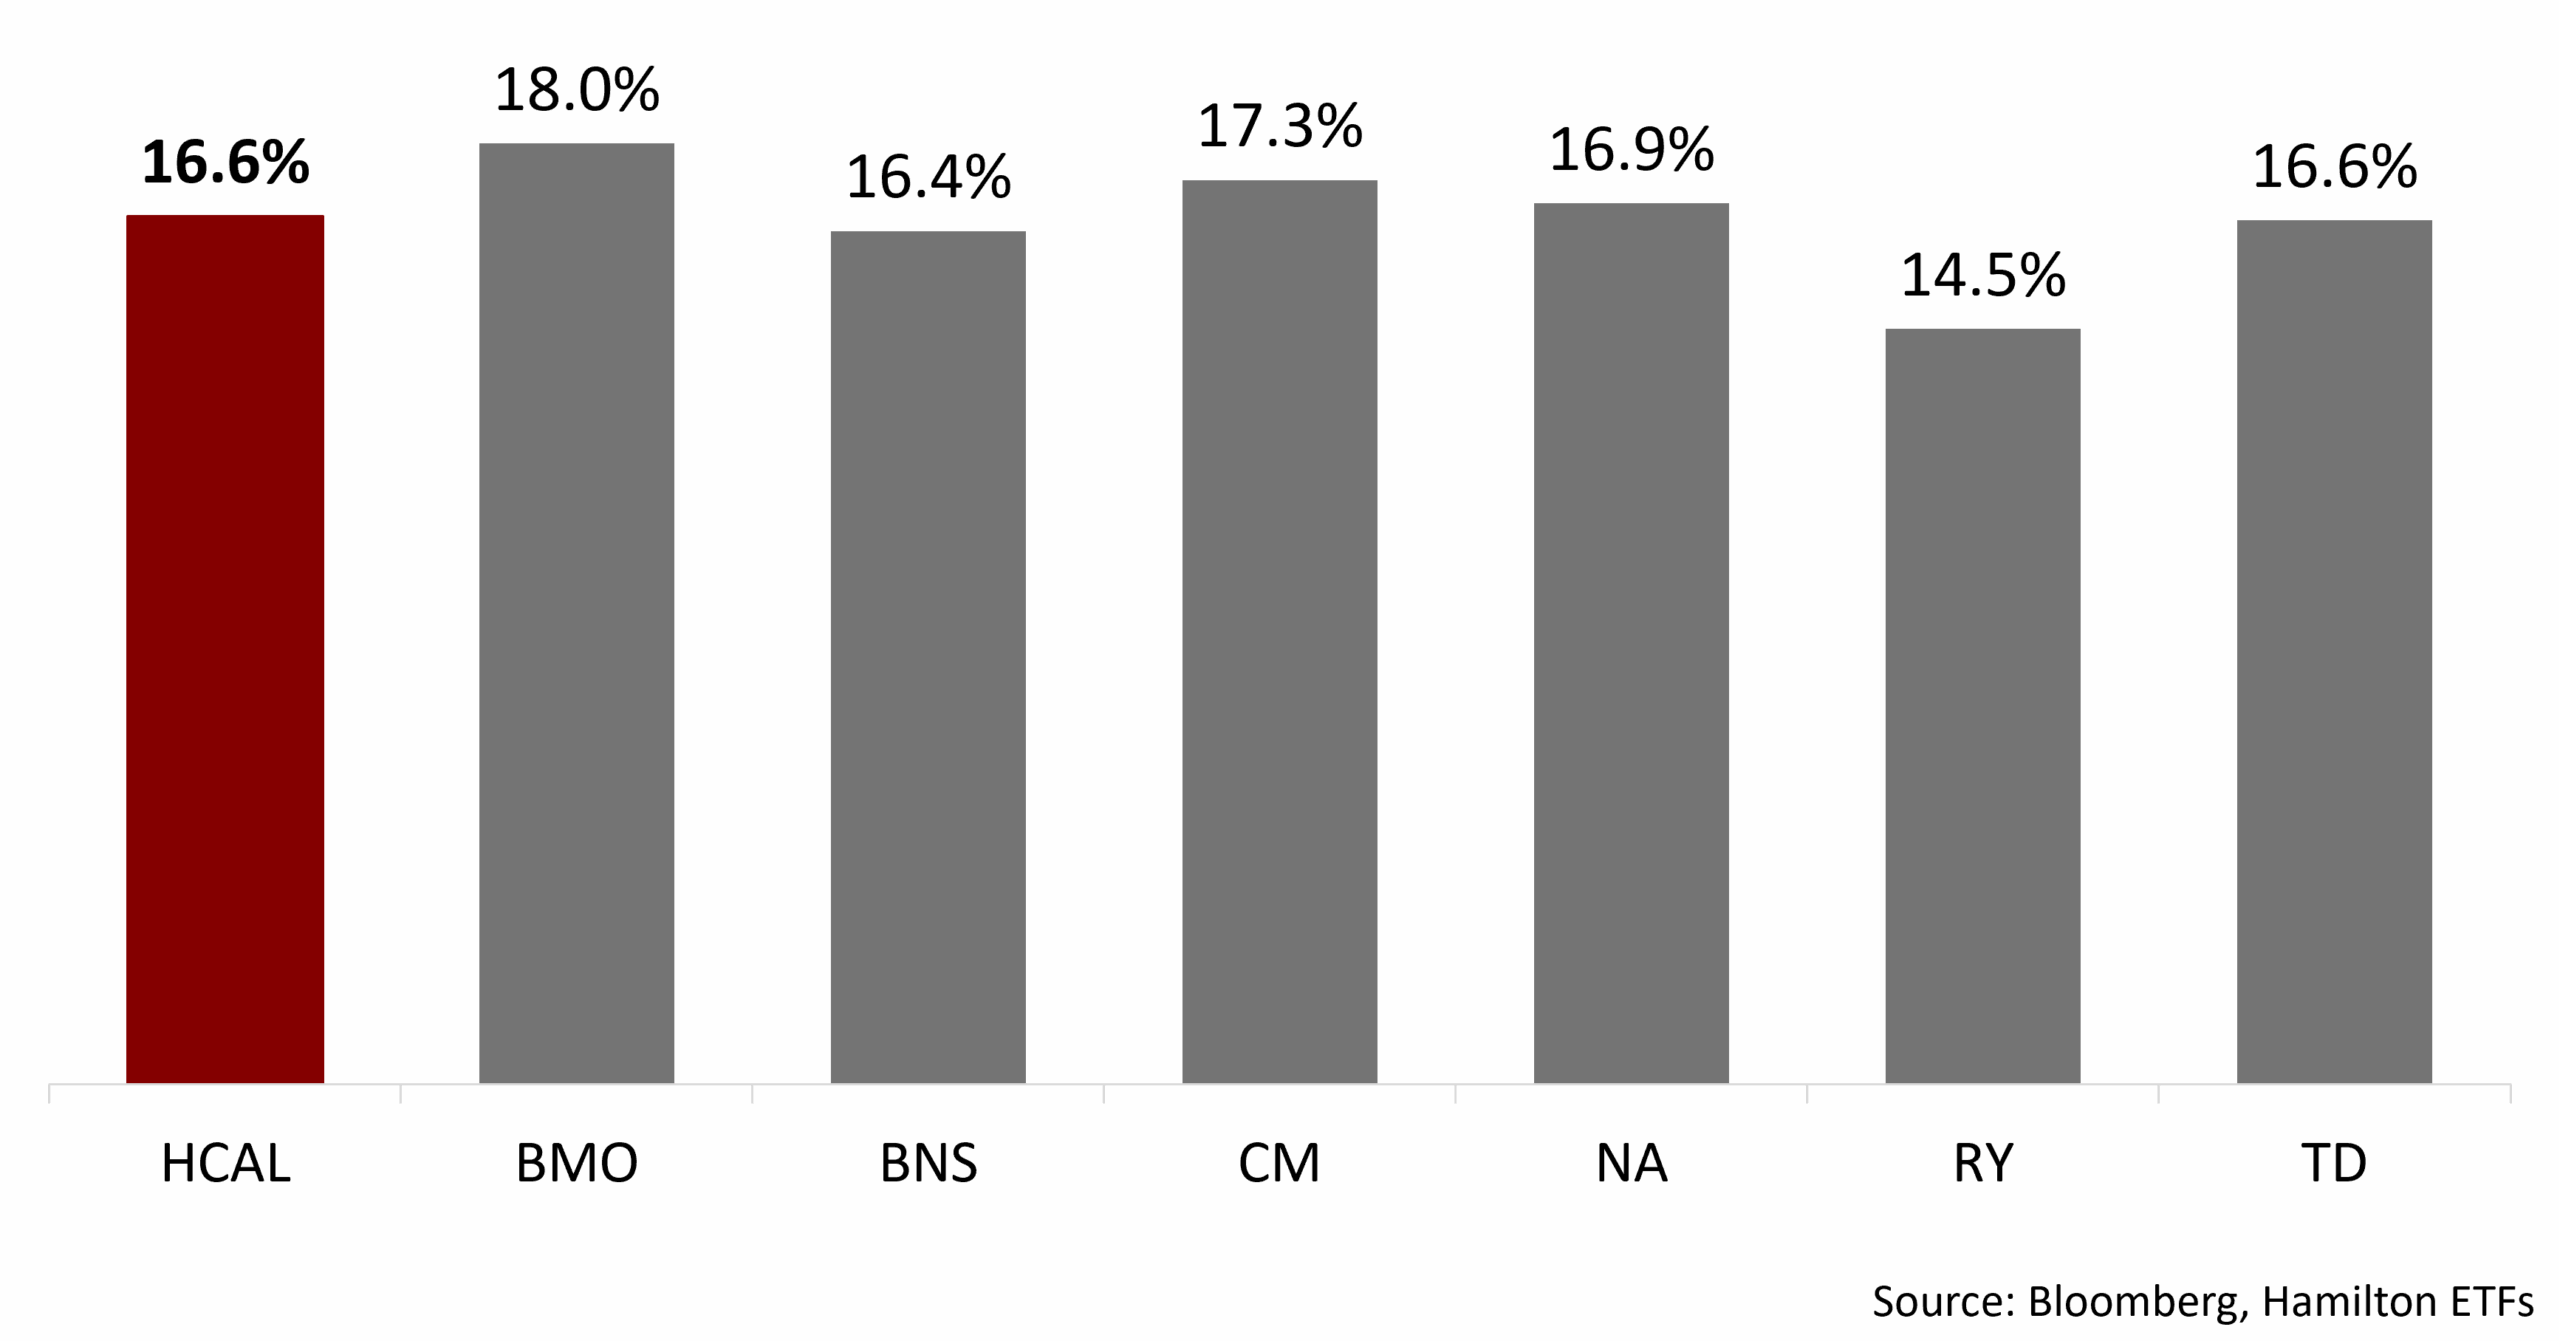
- Similar volatility to an individual Canadian bank stock: Since inception, the increase in volatility from the enhanced structure roughly offsets the decline in volatility from diversification. As a result, HCAL has had a volatility profile roughly equal to owning any single Canadian bank stock (see chart below).
The outcome?
HCAL has provided investors with strong returns over its 5-year track record. Since inception, it has provided investors with both a higher long-term return than the Big Six banks, at 30.3% annualized return (see table below) and higher yield with similar volatility to the Big Six Canadian banks.

Hamilton ETFs: Pioneers of Enhanced ETFs
Launched in October 2020, HCAL was Canada’s first “enhanced” ETF followed by the second, the Hamilton Enhanced Canadian Covered Call ETF (HDIV), which launched in July 2021. When creating HCAL, we chose 1.25x exposure, which we believe is a “Goldilocks” level of leverage, because our analysis and back-testing of the strategy suggested higher long-term return potential while maintaining a volatility profile similar to that of an individual Canadian bank stock[6].
Similar Volatility vs. Big Six Banks[7]
Over time, the power of compounding is a key driver of returns, and HCAL’s enhanced structure can amplify that effect. HCAL can be held in registered accounts, providing access to the benefits of low-cost leverage in accounts where margin isn’t normally available.
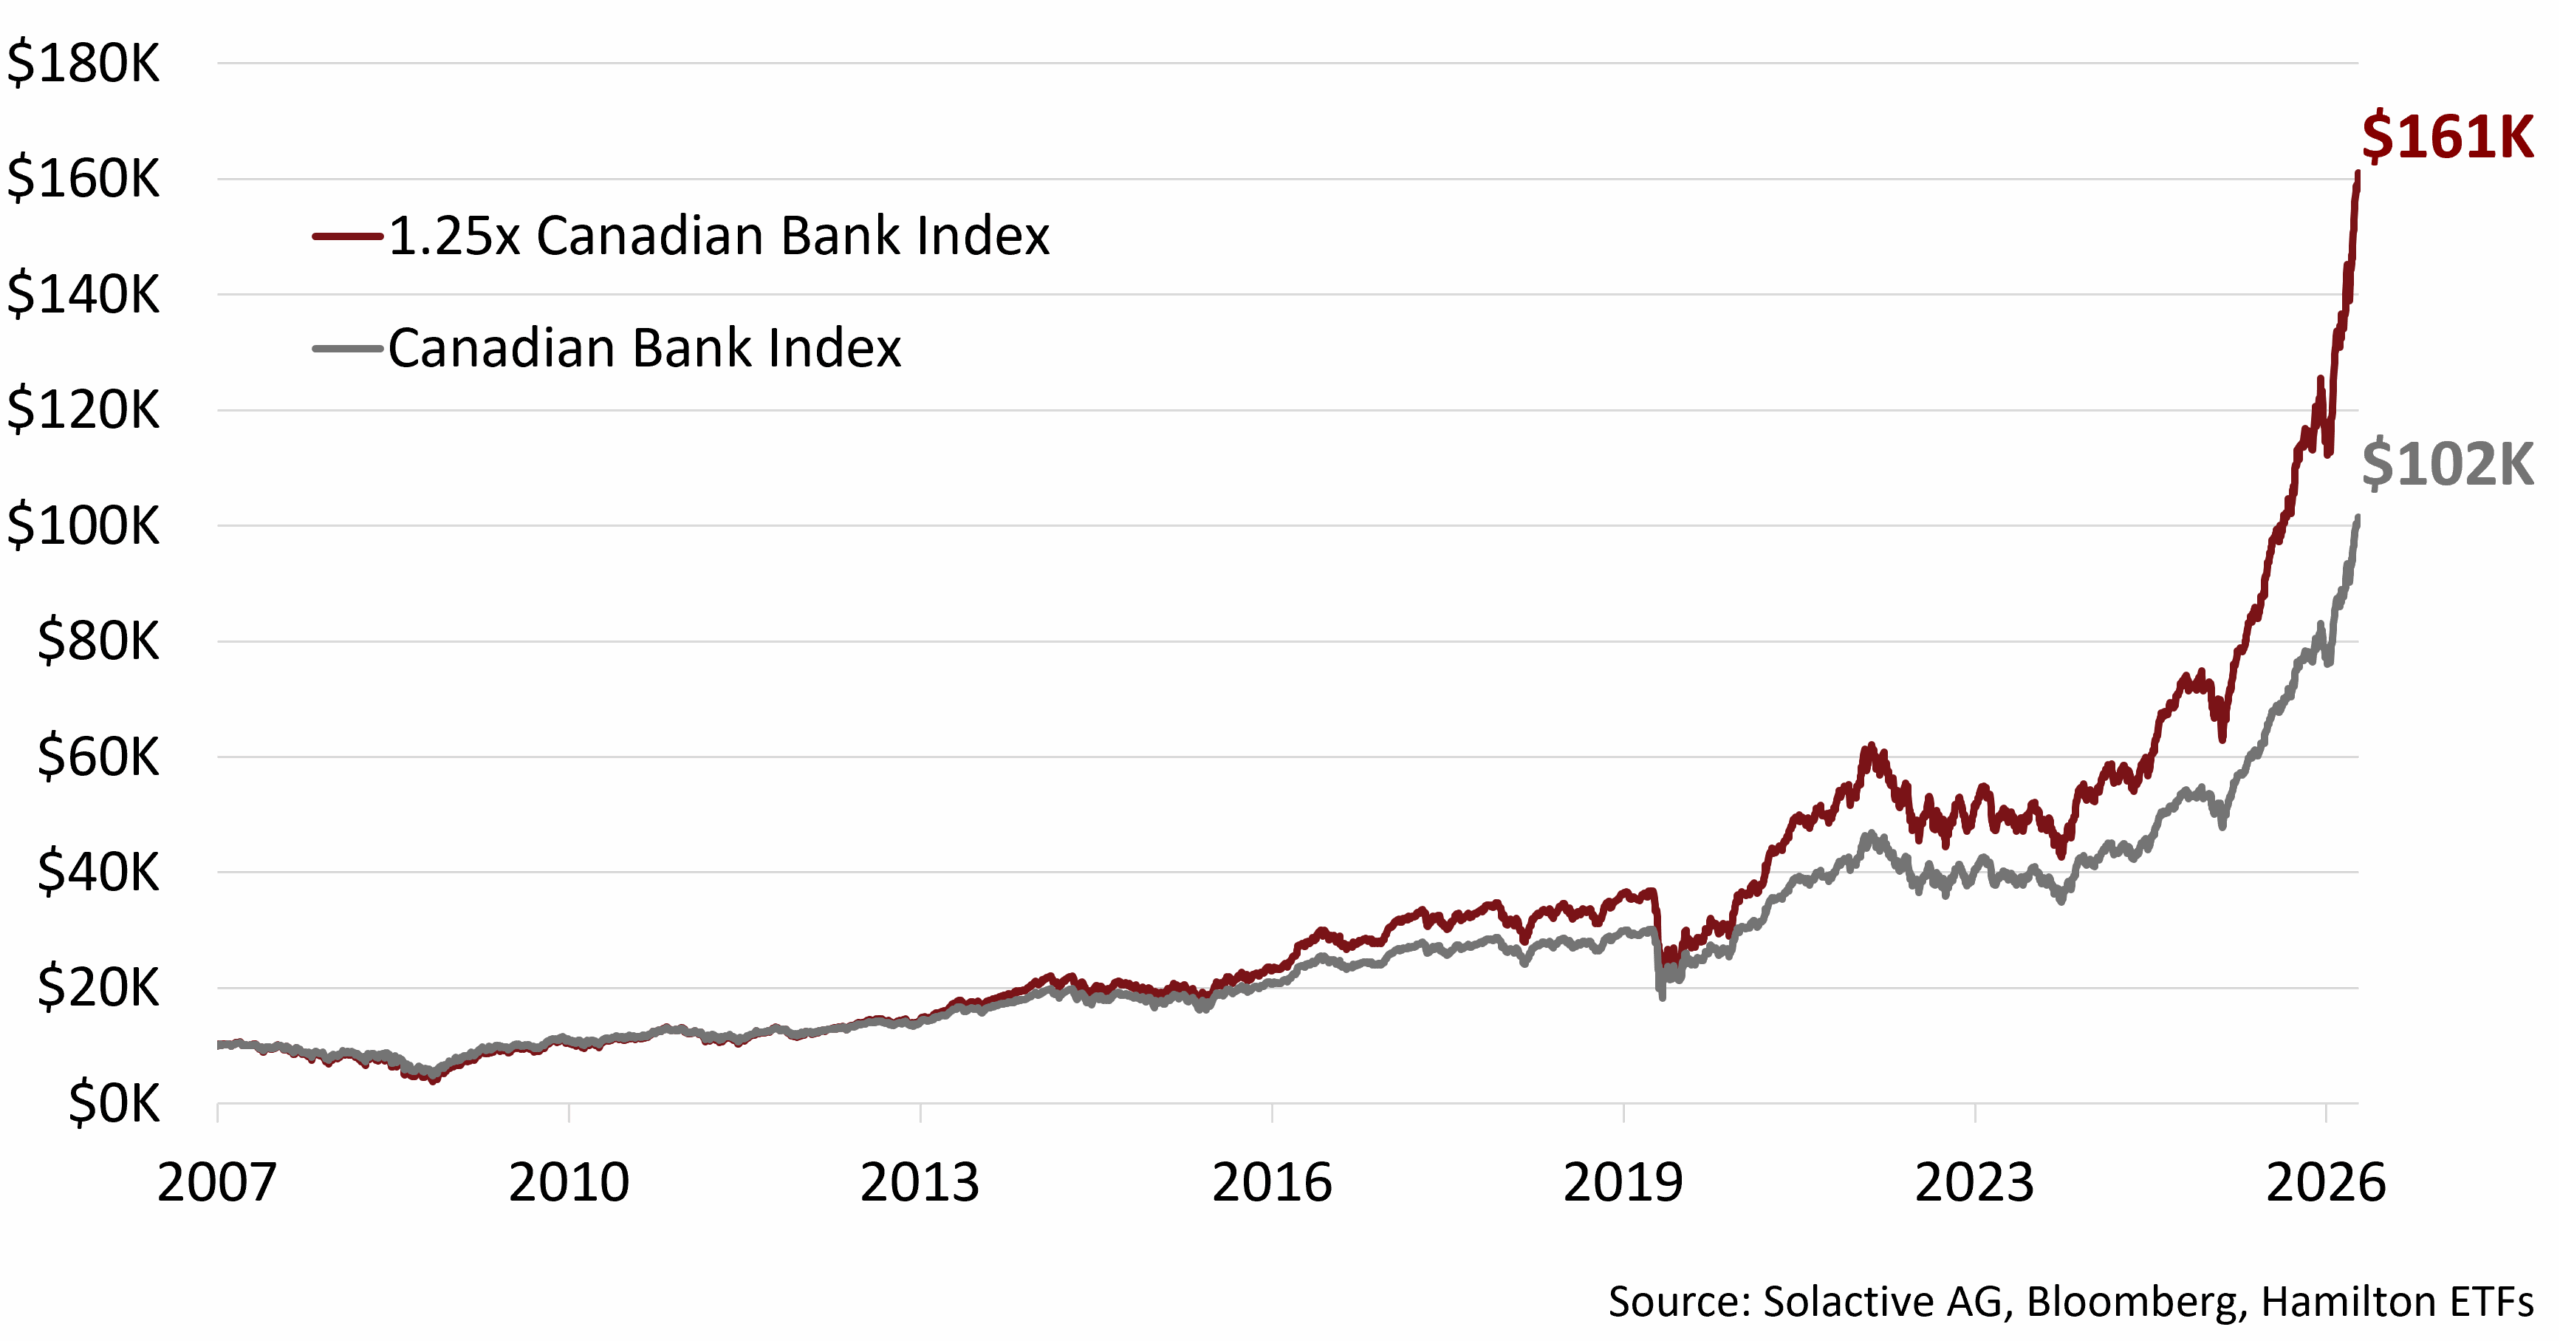
Leverage will magnify price movements in either direction, but the Canadian banks have a long history of stability, steady earnings, and consistent dividends, making them, in our view, a suitable foundation for this structure. The chart below illustrates how 1.25x exposure to the Big Six banks has compounded over nearly 20 years (since the Solactive Equal Weight Canada Banks Index’s inception), providing a meaningful impact on long-term performance.
Benefits of Enhanced Structure for Canadian Banks Since March 2007[8]
Enhanced Growth Structure With Other Trusted Sectors
With the success of HCAL, we thought Canadian investors could be getting more out of other blue-chip stocks as well, from the enhanced structure. We opted for rules-based indices and applied modest leverage to portfolios of large-cap stocks with established market leadership.
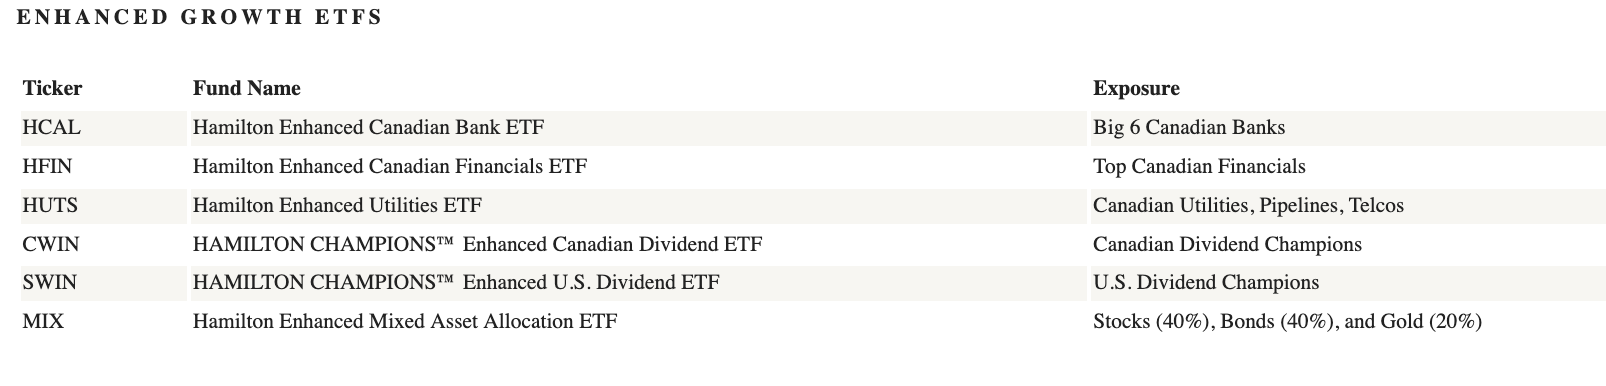 For example, the Hamilton Enhanced Utilities ETF (HUTS) provides the potential of a higher yield and enhanced return from an index of Canadian Utility, Telecom, and Pipeline companies. The Hamilton Enhanced Canadian Financials ETF (HFIN) does the same with an equal-weight portfolio of the top 12 largest Canadian financial services companies. HFIN was rated FundGrade A+ in 2025[9].
We also offer the Enhanced HAMILTON CHAMPIONS™ ETFs, CWIN and SWIN, which provide enhanced exposure to portfolios of blue-chip Canadian and U.S. companies with long histories of growing dividends.
Trivia
Which of Canada’s Big Six banks has the longest streak of uninterrupted dividend payments?
Hint: It was Canada’s “unofficial central bank” until 1935. It’s one of the holdings in HCAL.
Answer: Bank of Montreal. It is the oldest of the Big Six and began its unbroken record of dividend payouts in 1829, making it a 197-year streak.[10]
———
Commissions, management fees and expenses all may be associated with investments in exchange traded funds (ETFs) managed by Hamilton ETFs. Please read the prospectus before investing. The indicated rates of return are the historical annual compounded total returns including changes in per unit value and reinvestment of all dividends or distributions and does not take into account sales, redemptions, distribution or optional charges or income taxes payable by any securityholder that would have reduced returns. Only the returns for periods of one year or greater are annualized returns. ETFs are not guaranteed, their values change frequently, and past performance may not be repeated.

Certain statements contained in this note may constitute forward-looking information within the meaning of Canadian securities laws. Forward-looking information may relate to a future outlook and anticipated distributions, events or results and may include statements regarding future financial performance. In some cases, forward-looking information can be identified by terms such as “may”, “will”, “should”, “expect”, “anticipate”, “believe”, “intend” or other similar expressions concerning matters that are not historical facts. Actual results may vary from such forward-looking information. Hamilton ETFs undertakes no obligation to update publicly or otherwise revise any forward-looking statement whether as a result of new information, future events or other such factors which affect this information, except as required by law.
[1] Source: Solactive AG, Bloomberg, Hamilton ETFs. Data from March 16, 2007, to September 30, 2020.
[2] Total returns from December 31, 2020, to December 31, 2021. Source: Bloomberg
[3] Source: Solactive AG, Bloomberg, Hamilton ETFs. Data from October 14, 2020, to June 30,2026.
The graph illustrates the growth of an initial investment of $100,000 in HCAL vs. Solactive Equal Weight Canada Banks Index (“Canadian Bank Index”) with annual compounded total returns. The graph is for illustrative purposes only and intended to demonstrate the historical impact of compound growth. It is not a projection of future performance, nor does it reflect potential returns on investments in the ETF. Investors cannot directly invest in the index.
[4] As at June 30, 2026.
[5] An estimate of the annualized yield an investor would receive if the most recent distribution remained unchanged for the next 12 months, stated as a percentage of the price per unit on June 30, 2026. The yield calculation excludes any additional year end distributions and does not include reinvested distributions.
[6] Source: Solactive AG, Bloomberg, Hamilton ETFs. Data from March 16, 2007, to September 30, 2020.
[7] Standard deviation since October 14, 2020, at June 30, 2026. Source: Bloomberg, Hamilton ETFs
[8] Source: Solactive AG, Bloomberg, Hamilton ETFs. Data from March 16, 2007, to June 30, 2026.
The graph illustrates the growth of an initial investment of $10,000 in the Solactive Equal Weight Canada Banks Index (SOLCBEW) vs 1.25x SOLCBEW with annual compounded total returns. The graph is for illustrative purposes only and intended to demonstrate the historical impact of the indexes compound growth rate. It is not a projection of future index performance, nor does it reflect potential returns on investments in the ETF. Investors cannot directly invest in the index. All performance data assumes reinvestment of distributions and excludes management fees, transaction costs, and other expenses which would have impacted an investor’s returns.
[9] is used with permission from Fundata Canada Inc., all rights reserved. The annual FundGrade A+® Awards are presented by Fundata Canada Inc. to recognize the “best of the best” among Canadian investment funds. The FundGrade A+® calculation is supplemental to the monthly FundGrade ratings and is calculated at the end of each calendar year. The FundGrade rating system evaluates funds based on their risk-adjusted performance, measured by Sharpe Ratio, Sortino Ratio, and Information Ratio. The score for each ratio is calculated individually, covering all time periods from 2 to 10 years. The scores are then weighted equally in calculating a monthly FundGrade. The top 10% of funds earn an A Grade; the next 20% of funds earn a B Grade; the next 40% of funds earn a C Grade; the next 20% of funds receive a D Grade; and the lowest 10% of funds receive an E Grade. To be eligible, a fund must have received a FundGrade rating every month in the previous year. The FundGrade A+® uses a GPA-style calculation, where each monthly FundGrade from “A” to “E” receives a score from 4 to 0, respectively. A fund’s average score for the year determines its GPA. Any fund with a GPA of 3.5 or greater is awarded a FundGrade A+® Award. For more information, see www.FundGradeAwards.com. Although Fundata makes every effort to ensure the accuracy and reliability of the data contained herein, the accuracy is not guaranteed by Fundata. HFG has been recognized with a FundGrade A+® award in the Financial Services Equity CIFSC category, which includes 34 funds, as of December 31, 2025. The FundGrade rating was initiated on December 31, 2020. Performance for the ETF for the period ended December 31, 2025, was 23.05% (1 year), 24.10% (3 years), 17.58% (5 years), and 19.61% (since inception on June 26, 2020).
