

 Posted By

Fourth Quarter 2026 Strategy Report (Q4 2026)
By Bipan Rai, BMO ETF & Structured Solutions
(Sponsor Blog)
Both as an epic poem and as a summer blockbuster hit film, ‘The Odyssey’ offers many lessons. For those of us in the investment profession, the most important one is to appreciate the evolving risks and what they could mean for our base case scenarios: lest we end up lost like our hero Odysseus. And to be frank, there are a lot of similarities between the beginning of Odysseus’s journey and where we are in the market cycle right now.
Currently, we remain entrenched in the ‘reflation’ part of the macroeconomic cycle. That is when most leading indicators imply that economic growth remains firm while price pressures remain sticky. Recent data backs this view: with composite Purchasing Managers Indexes (PMIs) across the world’s largest economies still above levels that mark expanding economic growth (the notable exception being China).
The recent estimate for the September PMI reading in the U.S. indicates that businesses haven’t been this optimistic about future sales growth in years. That is also aligned to the strong U.S. data of late – including recent non-farm payrolls and retail sales reports – which suggests that the economy is expanding above its estimated potential growth rate.
This is the backdrop that we’ve operated in for several quarters, and it should continue to support broad risk appetite. However, we must also be mindful of the rising risks that are making this backdrop more precarious to those from prior quarters.
For instance, the conflict in the Middle East continues to complicate matters. It’s now been over seven months of below normal traffic through the Strait of Hormuz: with global shortages leading to a pronounced increase in the prices of both energy and refined products. That is directly feeding into producer and consumer prices such that central banks can no longer look past the second-round effects. Indeed, three of the ‘big four’ central banks have hiked policy rates over the past month (the Federal Reserve, or the Fed, the European Central Bank, the Bank of Japan). There is also a very good chance that the Bank of Canada will end up hiking rates at one of its two remaining meetings this year. These are the main reasons why front-end yields have been rising across several markets.
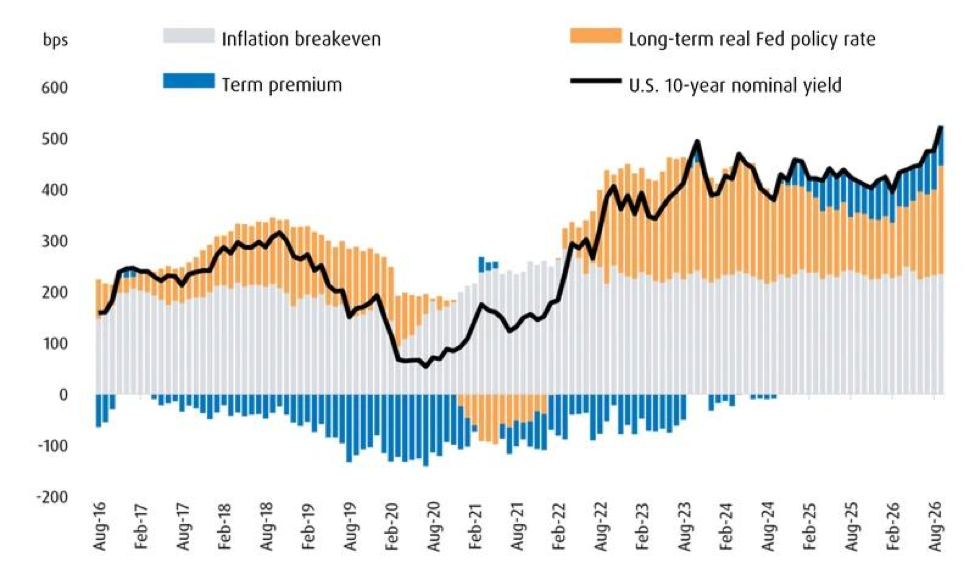
Equally important are the moves in the long end, which are being driven by a multitude of factors. For one, there is increased competition amongst issuers, with U.S. corporations (hyperscalers mainly) looking to term out borrowing. (1)That is ‘crowding out’ sovereign bonds in the long end.
Second, the artificial intelligence (AI) boom is compounding the narrative of robust U.S. economic growth, which is raising market estimates of the long-run neutral interest rate: pushing up long-end yields (2) in the process. Finally, credibility risk is rising as few countries are seriously considering fiscal discipline at this point. All these factors are weighing on buyers in the long end, who are now far more price sensitive than they have been in years past.
Chart 1 – Long-term drivers for U.S. long-end yields
Source: BMO Global Asset Management, Bloomberg, as of September 30, 2026.
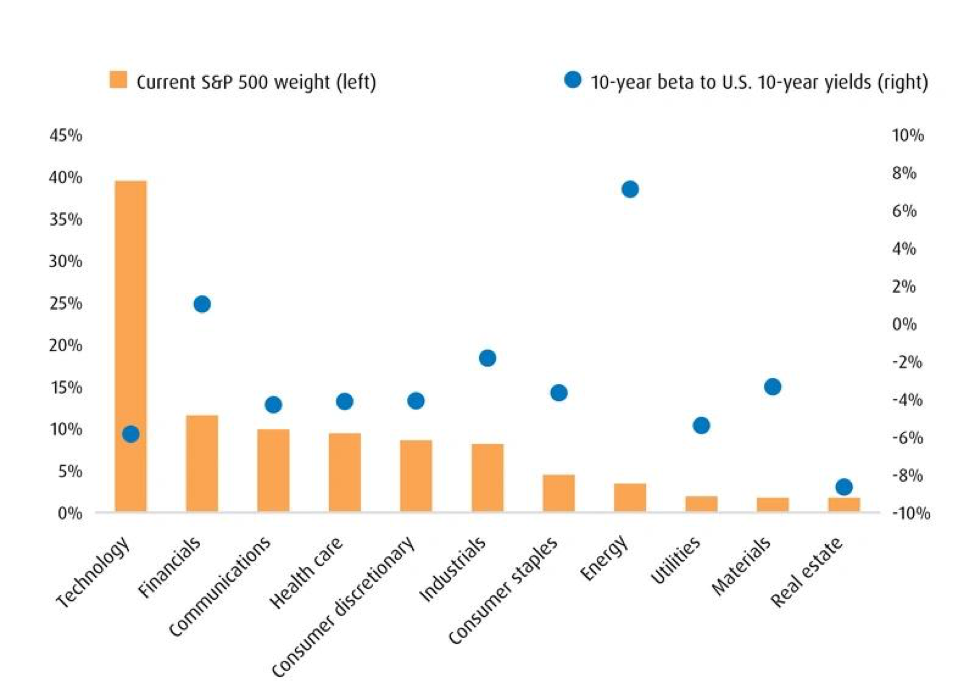
And remember that given its composition, the S&P 500 Index is effectively a long-duration asset. Sectors that are mostly made up of firms whose valuation depends heavily on distant future cash flows (like technology, communication services, consumer discretionary, etc.) make up around 60% of the index. That leaves them vulnerable to higher long-end yields.
Chart 2 – The majority of S&P 500 sectors are negatively correlated to U.S. 10-year yield shifts
Source: BMO Global Asset Management, Bloomberg, as of September 30, 2026.
Correlation: A statistical measure of how two securities move in relation to one another. Positive correlation indicates similar movements, up or down together, while negative correlation indicates opposite movements (when one rises, the other falls).
Another risk for markets is no longer a nascent one: the public backlash against AI. At the very least, this has been compounded by recent news that some frontier models had gone rogue, leading to a push within the industry for increased self-regulation or “pacing.” That compounds the lack of favourability of AI among the voting public that politicians are finding harder to ignore. For us, increased ‘pacing’ or regulation will matter given the heavy degree of capital investment we’ve seen go into the space. Any signs of waning demand or excess data center capacity imply a capex slowdown: a serious risk for both economic growth and for risk appetite.
The combination of higher-for-longer energy prices, bond yields and increased risk of AI regulation makes us a bit more nervous about the current reflation-like backdrop than we have been in the past. The easy gains are no longer there as we’re moving from participating in the reflation backdrop to navigating it.
For our fixed-income sleeve, remaining underweight is relatively straightforward. True, there is the temptation to look at higher yields as an opportunity, but the factors driving yields higher are too strong to fade at the current moment. At the very least, we’ll need to see evidence of slowing equity market and economic momentum before we become interested in the U.S. rates space.
For our alternatives sleeve, we’re remaining overweight given our unease with the current inflation picture.
Additionally, we are growing more cautious with our equity outlook. While we’re maintaining an overweight position in our equity sleeve, we’re reducing the amount of downside risk embedded in that position through a greater allocation to lower-volatility strategies. That allows us to participate in the upside, while paying greater tribute to the rising downside risks. As a result, our risk-weight for equities is substantially less than it has been in prior quarters.
To conclude, the journey is far from over. Like Odysseus, we remain committed to reaching our destination: but with the waters becoming more treacherous, we believe the next leg of the voyage calls for greater caution, not retreat.
Asset allocation
• Our modelling still suggests that we’re in the ‘reflation’ phase of the cycle: which generally favours cyclicals and commodities. However, we’re now entering a different part of the monetary cycle (towards tightening), which means we need to exercise more caution when it comes to allocation and security selection.
• We’re sticking with an underweight position for duration/income. That reflects our concern on the current inflation trend as well as the supply/demand factors that are playing out in the long end of the curve. For now, we favour Canadian dollar (CAD) duration over the U.S., though we may look to add to the latter if we see signs of slowing growth in upcoming data.
• Relative to Q2, we’ve pared some of the risk in our growth sleeve in two ways. For one, we’ve reduced our equity weight. Second, we’re allocating more weight to products that are lower volatility in nature to reduce the risk weight of the equity sleeve. Of course, we’re still overweight equities as we feel the backdrop is constructive, but the shifts pay tribute to the fact that there’s less room for error from here.
• Within the alternatives sleeve, we’ve increased our allocation slightly and will continue to maintain an overweight position. Again, this reflects our concern with the sticky nature of the inflation and the need for adequate hedges in the portfolio. In terms of currency implementation, we’re electing to keep our U.S. equity and alternatives exposure unhedged while maintaining a hedged position on our U.S. fixed-income exposure. This reflects our view that U.S. dollar (USD) risk mitigates the overall volatility of the equities/alternatives sleeves more effectively.
• USD/CAD has moved higher by over 2% in September. This is likely due to general strength in the USD against most developed currencies – which itself is partly due to a reassessment of Fed tightening expectations. Nevertheless, we are due for some consolidation in USD/CAD, albeit above the 1.40 mark.
Fixed income
• We’re curbing our core position in U.S. duration (ZUAG/F – BMO US Aggregate Bond Index ETF Hedged) and in our tactical position for Canadian bank credit (ZBI – BMO Canadian Bank Income Index ETF). We’re using both to fund a position in U.S. AAA CLOs (via ZAAA/F – BMO AAA CLO ETF Hedged).
• For Canadian bank credit, we felt it was prudent to trim our allocation given current positioning. For ZAAA, we like the floating rate exposure in this environment and generally feel that private sector balance sheets are in decent shape for now.
Equities
• We’ve shifted the weights for our core positions in ZUQ (BMO MSCI USA High Quality Index ETF) and ZEA (BMO MSCI EAFE Index ETF). Indeed, we’ve cut the allocation to the former and added to the latter to reduce the volatility contribution from the equity sleeve while also diversifying geographically.
• Within the tactical positions, we’re halving our allocation to ZEM (BMO MSCI Emerging Markets Index ETF) and removing our positions in ZLU (BMO Low Volatility US Equity ETF) and ZWB (BMO Covered Call Canadian Banks).
• In line with our goal of lowering the overall risk weight of our equity allocations, we are introducing two new tactical positions: ZOCT (BMO US Equity Buffer ETF – October) and ZPAY (BMO Premium Yield ETF). Both of these exposures are in sympatico with our view that equity markets should consolidate while also paying tribute to rising risks.
Alts
• Again, the ‘sticky’ nature of inflation concerns us right now, which is why we’re opting to maintain our overweight for the alternatives sleeve.
• We’re upping our allocation to gold – but swapping out of ZWGD (BMO Covered Call Spread Gold Bullion ETF) and into ZGLD (BMO Gold Bullion ETF). We’re maintaining a position for the former in our other portfolios
Sources
1 Term out: converting short-term debt or revolving credit into a longer-term loan.
2 Long-end yields: interest rates on fixed-income securities with long-term maturities, typically spanning 10 to 30 years.
 Bipan Rai is Head of ETF and Structured Solutions Strategy, Exchange Traded Funds for BMO Global Asset Management. Bipan joined BMO Global Asset Management in 2024 and currently serves as Head of ETF Strategy, delivering strategic research for the ETF and Structured Solutions team. He is highly regarded for his macroeconomic insights as well as his knowledge of market structure for various asset classes. His focus is on fundamental macro research and the implications for the ETF market place, including economic, monetary and fiscal policy analysis alongside developments in funding and liquidity. Prior to joining BMO GAM, Bipan spent 13 years as a top-ranked strategist at a large Canadian dealer. He has won several awards for his research from various publications (Greenwich Survey, Bloomberg) and is a regular contributor to global business media outlets (BNN/Bloomberg, CNBC, WSJ). He holds an MBA from the Schulich School of Business at York University and a Bachelor of Engineering degree (Aerospace Engineering) from Toronto Metropolitan University.
Disclaimers
This content is sponsored by BMO ETFs. This social media network is an independent organization and is not affiliated with BMO ETFs or BMO Global Asset Management.

This content is intended for information purposes only. Financial Independence Hub is compensated under this arrangement by BMO ETFs.

Any statement that necessarily depends on future events may be a forward-looking statement. Forward-looking statements are not guarantees of performance. They involve risks, uncertainties and assumptions. Although such statements are based on assumptions that are believed to be reasonable, there can be no assurance that actual results will not differ materially from expectations. Investors are cautioned not to rely unduly on any forward-looking statements. In connection with any forward-looking statements, investors should carefully consider the areas of risk described in the most recent prospectus.

The viewpoints expressed by the author represents their assessment of the markets at the time of publication. Those views are subject to change without notice at any time. The information provided herein does not constitute a solicitation of an offer to buy, or an offer to sell securities nor should the information be relied upon as investment advice. Past performance is no guarantee of future results.

This communication is for information purposes. The information contained herein is not, and should not be construed as, investment, tax or legal advice to any party. Particular investments and/or trading strategies should be evaluated relative to the individual’s investment objectives and professional advice should be obtained with respect to any circumstance.

CLOs are floating- or fixed-rate debt securities issued in different tranches, with varying degrees of risk, by trusts or other special purpose vehicles (“CLO Issuers”) and backed by an underlying portfolio consisting primarily of below investment grade corporate loans. The BMO ETF pursues its investment objective by investing, under normal circumstances, at least 85% of its net assets in CLOs that, at the time of purchase, are rated AAA or the equivalent by a nationally recognized statistical rating organization.

AAA herein refers to the order of payments, should there be any defaults, and does not represent the ratings of the underlying loans within the CLO. If there are loan defaults or the CLO Issuer’s collateral otherwise underperforms, scheduled payments to senior tranches take precedence over those of mezzanine tranches (a tranche or tranches subordinated to the senior tranche), and scheduled payments to mezzanine tranches take precedence over those to subordinated/equity tranches. The riskiest portion is the “Equity” tranche, which bears the first losses and is expected to bear all or the bulk of defaults from the corporate loans held by the CLO Issuer serves to protect the other, more senior tranches from default.

BMO Broad Commodity ETF is an exchange-traded alternative mutual fund within the meaning of NI 81-102. As an alternative mutual fund, the BMO ETF has the ability to invest in asset classes and use investment strategies that are not permitted for conventional mutual funds, including the ability to invest in other alternative mutual funds, employ leverage and borrow cash to use for investment purposes and increased ability to invest in commodities. While these strategies will be used in accordance with the BMO ETF’s investment objective and strategies, during certain market conditions, they may accelerate the pace at which an investor’s investment decreases in value.

An investor that purchases Units of a Structured Outcome ETF other than on the first day of a Target Outcome Period and/or sells Units of a Structured Outcome ETF prior to the end of a Target Outcome Period may experience results that are very different from the target outcomes sought by the Structured Outcome ETF for that Target Outcome Period. Both the cap and, where applicable, the buffer are fixed levels that are calculated in relation to the market price of the applicable Reference ETF and a Structured Outcome ETF’s NAV (as Structured herein) at the start of each Target Outcome Period. As the market price of the applicable Reference ETF and the Structured Outcome ETF’s NAV will change over the Target Outcome Period, an investor acquiring Units of a Structured Outcome ETF after the start of a Target Outcome Period will likely have a different return potential than an investor who purchased Units of a Structured Outcome ETF at the start of the Target Outcome Period. This is because while the cap and, as applicable, the buffer for the Target Outcome Period are fixed levels that remain constant throughout the Target Outcome Period, an investor purchasing Units of a Structured Outcome ETF at market value during the Target Outcome Period likely purchase Units of a Structured Outcome ETF at a market price that is different from the Structured Outcome ETF’s NAV at the start of the Target Outcome Period (i.e., the NAV that the cap and, as applicable, the buffer reference). In addition, the market price of the applicable Reference ETF is likely to be different from the price of that Reference ETF at the start of the Target Outcome Period. To achieve the intended target outcomes sought by a Structured Outcome ETF for a Target Outcome Period, an investor must hold Units of the Structured Outcome ETF for that entire Target Outcome Period.

Index returns do not reflect transactions costs or the deduction of other fees and expenses and it is not possible to invest directly in an Index. Past performance is not indicative of future results.

The BMO ETFs referred to herein are not sponsored, endorsed, or promoted by MSCI Inc. (MSCI) and MSCI bear no liability with respect to an ETF or any index on which such BMO ETF is based. The ETF’s prospectus contains a more detailed description of the limited relationship that MSCI has with the BMO Asset Management Inc. and any related BMO ETF.

The Index is a product of S&P Dow Jones Indices LLC or its affiliates (“SPDJI”), and has been licensed for use by BMO Asset Management Inc.. S&P®, S&P 500®, US 500, The 500, iBoxx®, iTraxx® and CDX® are trademarks of S&P Global, Inc. or its affiliates (“S&P”) and Dow Jones® is a registered trademark of Dow Jones Trademark Holdings LLC (“Dow Jones”), and these trademarks have been licensed for use by SPDJI and sublicensed for certain purposes by BMO Asset Management Inc.. The relevant BMO ETF is not sponsored, endorsed, sold or promoted by SPDJI, Dow Jones, S&P, their respective affiliates, and none of such parties make any representation regarding the advisability of investing in such product(s) nor do they have any liability for any errors, omissions, or interruptions of the Index.

BLOOMBERG® and the Bloomberg Index are service marks of Bloomberg Finance L.P. and its affiliates, including Bloomberg Index Services Limited (BISL), the administrator of the index (collectively, Bloomberg) and have been licensed for use for certain purposes by BMO Asset Management Inc. Bloomberg is not affiliated with BMO Asset Management Inc., and Bloomberg does not approve, endorse, review, or recommend any BMO ETFs. Bloomberg does not guarantee the timeliness, accuracy or completeness of any data or information relating to the BMO ETFs.

BMO ETFs are not in any way sponsored, endorsed, sold or promoted by FTSE Global Debt Capital Markets Inc. (FGDCM), FTSE International Limited (FTSE), Frank Russell Company (Frank Russell), FTSE Fixed Income LLC (FTSE FI) or the London Stock Exchange Group companies (together with FGDCM, FTSE, Frank Russell and FTSE FI, the Licensor Parties). The Licensor Parties make no claim, prediction, warranty or representation whatsoever, expressly or impliedly, either as to (i) the results to be obtained from the use of the FTSE BMO ETF Indices, (ii) the figure at which any of the FTSE BMO ETF Indices stands at any particular time on any particular day or otherwise, or (iii) the suitability of an Underlying Index for the particular purpose to which it is being put in connection with the FTSE BMO ETFs. Each of the FTSE BMO ETF Indices is compiled and calculated by FGDCM of FTSE and all copyright in any of the FTSE BMO ETF Indices values and constituent lists vests in FGDCM or FTSE, respectively. The Licensor Parties shall not be liable (whether in negligence or otherwise) to any person for any error in any of the FTSE BMO ETF Indices and the Licensor Parties shall not be under any obligation to advise any person of any error therein. FTSE® is a trade mark of the London Stock Exchange Group companies and is used under licence.

You cannot invest directly in an index.

Commissions, management fees and expenses all may be associated with investments in exchange-traded funds. Please read the ETF Facts or prospectus of the BMO ETFs before investing. Exchange-traded funds are not guaranteed, their values change frequently and past performance may not be repeated.

For a summary of the risks of an investment in the BMO ETFs, please see the specific risks set out in the BMO ETF’s prospectus. BMO ETFs trade like stocks, fluctuate in market value and may trade at a discount to their net asset value, which may increase the risk of loss. Distributions are not guaranteed and are subject to change and/or elimination.

BMO ETFs are managed by BMO Asset Management Inc., an investment fund manager, a portfolio manager, and a separate legal entity from Bank of Montreal.

BMO Global Asset Management is a brand name under which BMO Asset Management Inc. and BMO Investments Inc. operate.

“BMO (M-bar roundel symbol)” is a registered trademark of Bank of Montreal, used under licence.