

 Posted By
The 4% rule was built on the luckiest jar on the shelf.

By Hootan Nakhost
Special to Financial Independence Hub
The 4% rule is an American rule
The 4% rule is one of the best-known rules in personal finance. It originates from a 1994 study by financial planner William Bengen. He calculated the maximum safe withdrawal rate for every retirement start year since 1926. He found that withdrawing 4% or less of the starting portfolio in the first year, then raising that amount with inflation each year, lasted 30 years in every case he tested.
The 4% rule is useful because it is simple: you just need to remember one number. Take how much you spend each year, divide by 0.04 (or multiply by 25), and that is the money you need to retire.
One country is a small sample
The 4% number is based on a single country’s history that happens to be one of the best-performing markets in the world. Since 1926, the U.S. hasn’t had a war fought on its own soil, and since 1945 it has been the world’s major power. Retirees in other rich countries were not so lucky. Japan’s Nikkei index took 34 years to get back to its 1989 peak. In the UK, stocks fell about 73% in 1973–74, and inflation reached about 24% in 1975. German savers were wiped out twice: by the 1923 hyperinflation and again by the 1948 currency reform. None of this shows up in U.S. history.
What I tested, and what I found
My simulator uses the Dimson-Marsh-Staunton dataset, which covers stocks, bonds and inflation back to 1900 for most countries; I used the 25 of its countries that count as developed markets, each only from the year it became one (Japan from 1930, Spain from 1959), following Anarkulova et al. (2023) where the data allow.
For this post I replayed the same 30-year retirement 10,000 times, stitched together from blocks of real history from 1900 to 2024: once with U.S. history only, and once with all 25. In the 25-country case, each block of history comes from a country drawn at random. This setup avoids the survivorship bias you get when you always pick the U.S. as the home country. The retiree holds either 100% stocks or a balanced 60/40 portfolio, and spends a fixed, inflation-adjusted amount. To keep it simple, there are no taxes, fees or government benefits.
Bengen asked for a rate that never failed in U.S. history. With thousands of simulated retirements, some will always fail, so I report the rate that lasted 30 years in 9 out of 10 of them.
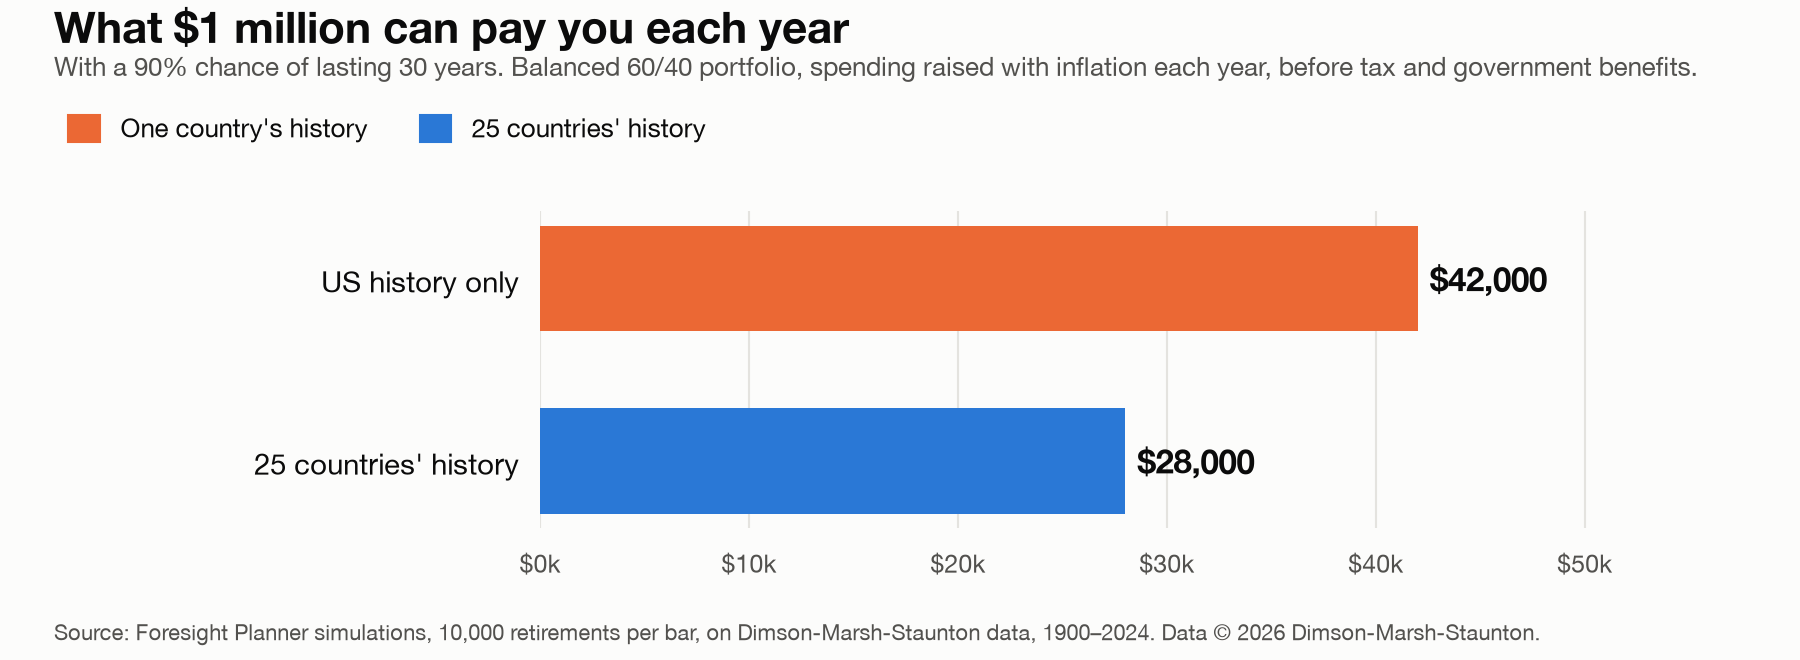
Once each retiree’s home market can be any of the 25 countries, the rate that lasts 30 years 90% of the time falls by about a third.
What gets you back to 4%
The weak 25-country result assumed each retiree held only their home market. With 30% of the stocks at home and 70% in the rest of the world, the same 60/40 portfolio’s rate rises from 2.8% to 3.6%. With 100% stocks, it reaches about 4.1%.
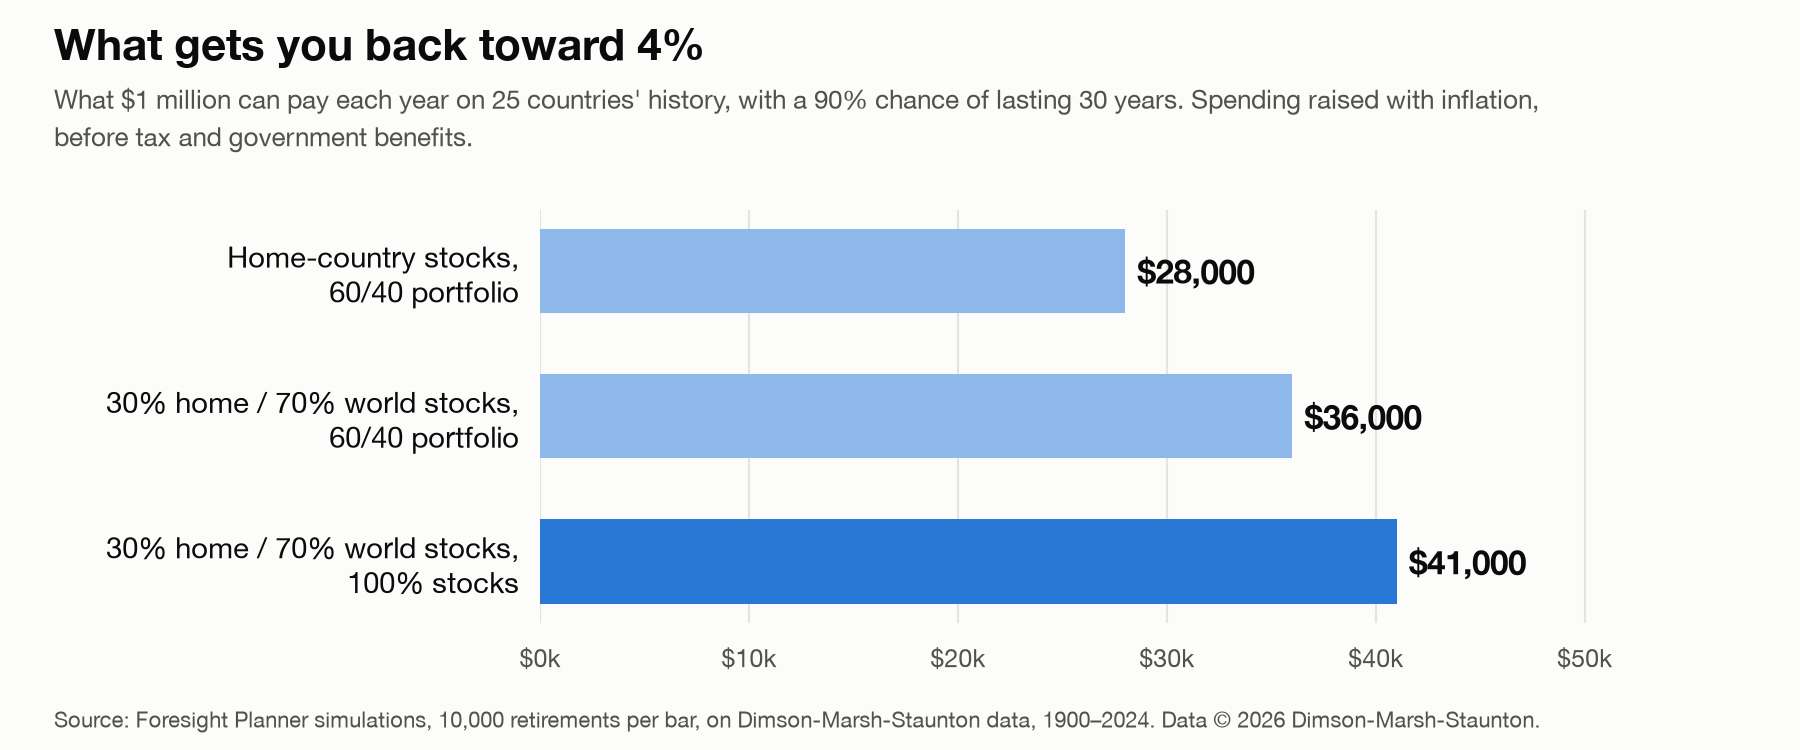 In this test, bonds lowered the rate. The simulation always uses the retiree’s own country’s bonds, the kind that inflation and war destroyed, so the finding is narrow: home-country bonds didn’t add safety. Global and real-return bonds weren’t tested.
One caveat: an all-stock portfolio can lose half its value in a crash, and the simulation assumes you never sell.
Do you even need 4%?
Benefits in Canada like CPP and OAS change the question. They’re indexed to inflation and paid for life, so your savings only have to cover the gap. Consider a 65-year-old couple with C$1 million in home-country stocks and maximum CPP and full OAS, about $54,500 a year at 2026 rates. Under the 25 countries’ history, their savings can add about $27,500 a year, 2.75% of the $1 million. Together that’s about $82,000 a year of spending, two-thirds of it from benefits. Maximum CPP is uncommon, and these figures are before tax and any OAS clawback. The number that matters is how much of the spending the portfolio has to cover.
What I take from this
On U.S. history alone, about 4.2% held up. Across 25 countries, a home-only 60/40 portfolio held up at about 2.8% and a balanced global one at about 3.6%. Only an all-stock portfolio spread around the world held up at 4%, and only for a retiree who could sit through a 50% drop without selling.
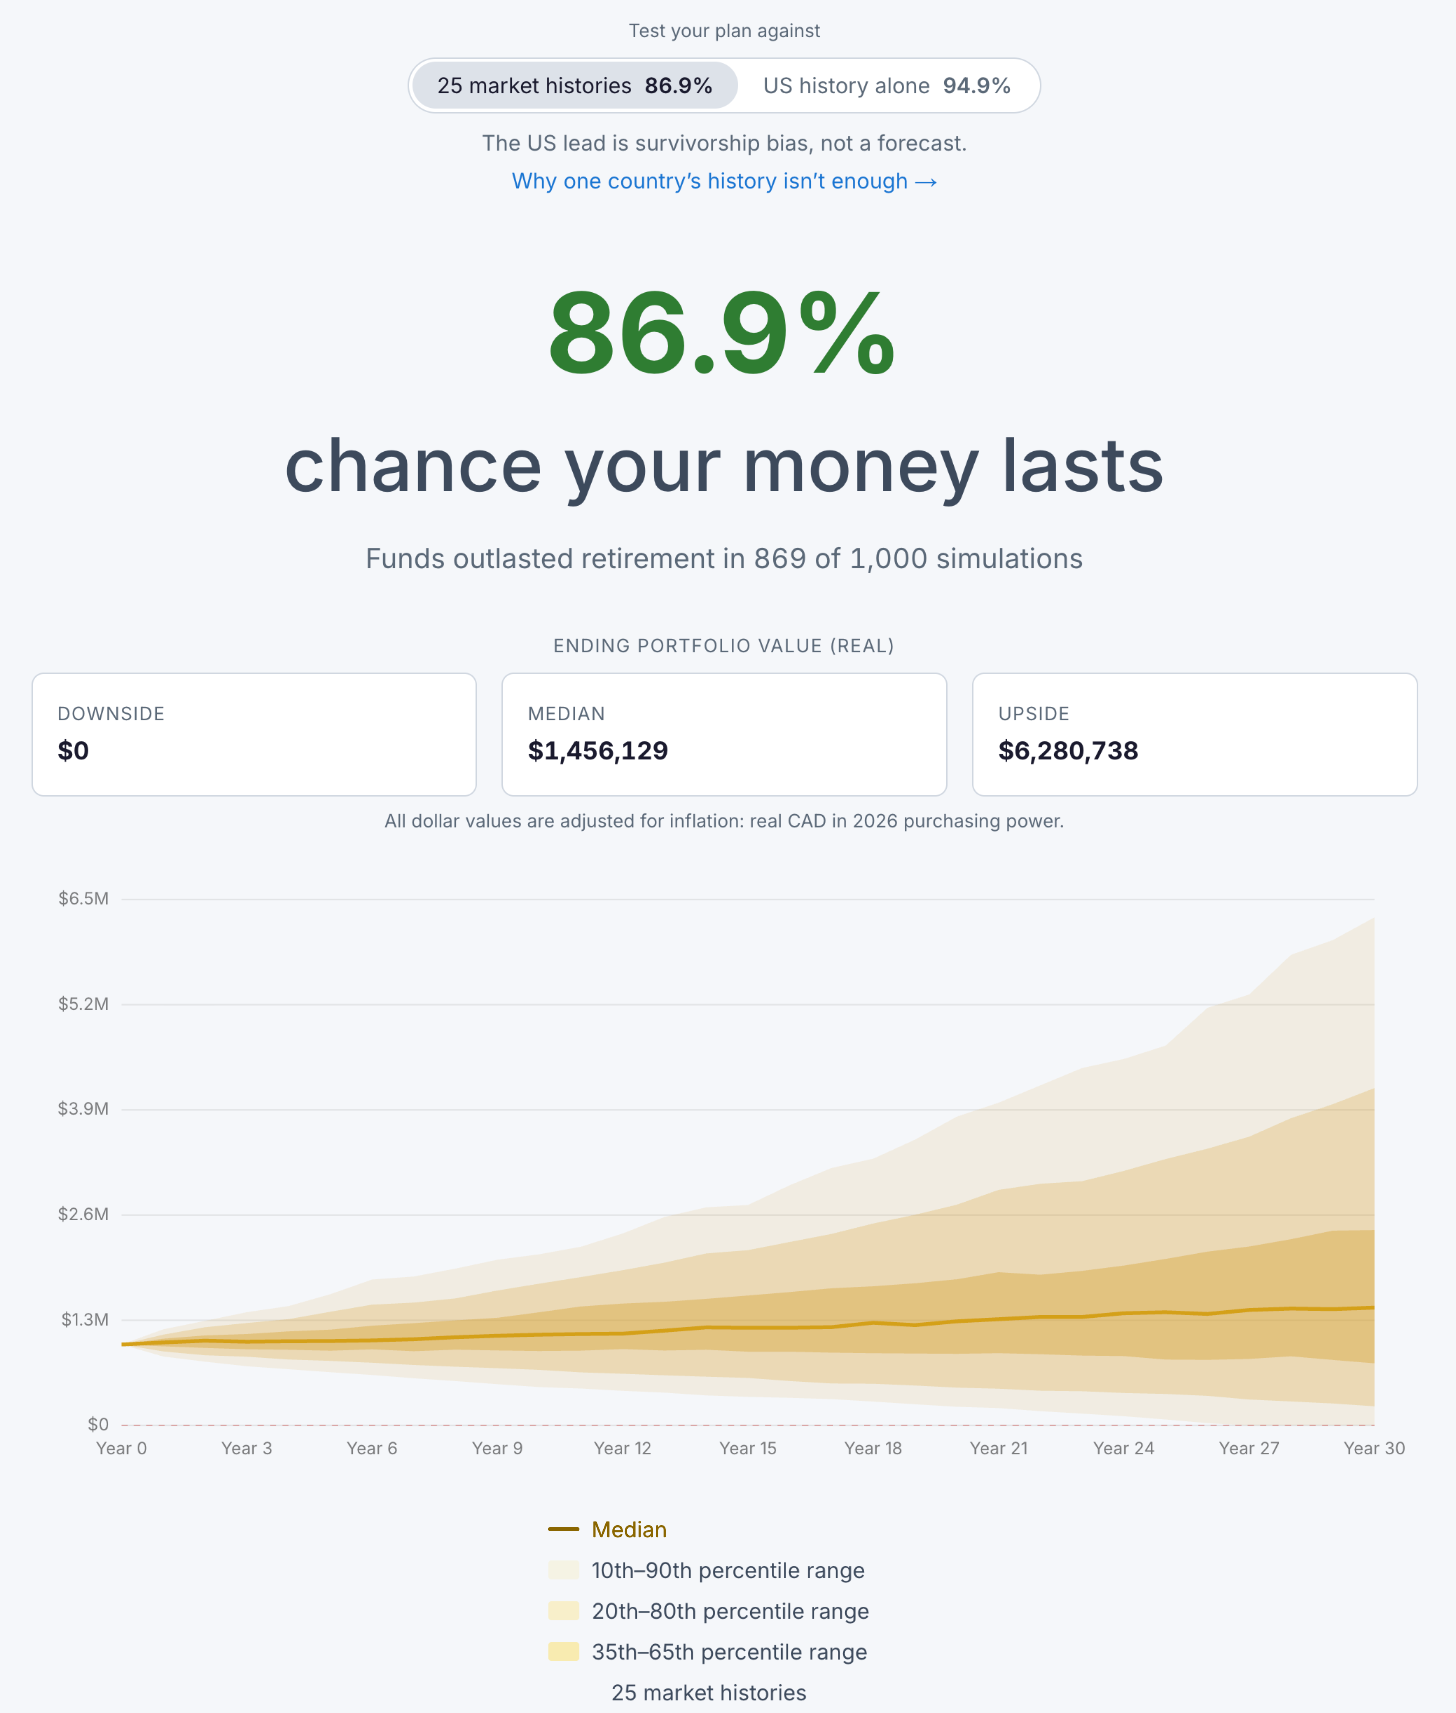
Those are still single numbers. One number is easy to remember, and that’s why the 4% rule caught on. But a real plan has CPP and OAS, taxes, RRIF minimums and spending that changes over time, and one number can be far off once you add them. So rather than lean on any one rate, I’d test the whole plan: the actual benefits, accounts and spending, against more history than one country’s best century.
I built Foresight Planner to run this kind of test on a Canadian plan, with CPP, OAS and RRIF minimums included. You can build and test a full plan for free at foresightplanner.com.
 Hootan Nakhost spent 12 years at Google, most recently as a Staff Research Engineer, and holds a PhD in computing science from the University of Alberta. He is the founder of Foresight Planner, based in Waterloo, Ontario, which brings modern statistical methods and more than a century of global market history to retirement planning for Canadians.
This post is for general information only and isn’t financial advice. The results are simulations on historical data, not predictions; your own situation may differ.
Method: 10,000 simulated 30-year retirements per case, built from blocks of real 1900–2024 market history averaging 10 years; in the 25-country case, each block's home market is drawn at random from 25 developed markets. Withdrawals are fixed in real terms, with no taxes or fees. Full method and sources: foresightplanner.com/methodology. Data: © 2026 Dimson-Marsh-Staunton. All Rights Reserved. The Dimson-Marsh-Staunton information contained herein is proprietary to Dimson-Marsh-Staunton and/or its content providers, may not be copied or distributed, and is not warranted to be accurate, complete or timely. Sources: E. Dimson, P. Marsh & M. Staunton, Triumph of the Optimists: 101 Years of Global Investment Returns (Princeton University Press, 2002). E. Dimson, P. Marsh & M. Staunton, Global Investment Returns Yearbook 2026 (Zurich: UBS, 2026). DMS Global Investment Returns data covering 1900–2025.