I recently updated the returns for the Canadian asset allocation ETFs. The returns over the last year and three years can be described as abnormal returns. So much so that I had to double-check the performance for the equity markets that fuelled this incredible run. How did they do it?
Over the last three years equity markets have delivered average annual returns that are 60% to 100% greater than historical averages. The U.S. has delivered outsized returns over the last five years and beyond. In fact, coming out of the financial crisis U.S. equity returns are nothing short of spectacular.
Here’s the Canadian asset allocation ETF page that shows the returns for the major Canadian asset allocation ETF providers. You’ll also see a ranking by risk level.
And here’s an overview of the assets that drove the returns for the (wonderful) managed all-in-one global ETF portfolios. Also, bonds stopped being a portfolio anchor over the last three years, as inflation is under control (for now).
U.S. stocks XUS-T
International stocks XEF-T
Canadian stocks XIC-T
Canadian bonds XBB-T
U.S. bonds (in U.S. Dollars) AGG
A look at iShares asset allocation ETFs
Here’s an example of the returns for iShares asset allocation ETFs.
The returns are incredible, especially over the last year and three years. Five-year returns are abnormally generous as well.
Here’s an example of the asset allocation and holdings of iShares XGRO, with a target of 80% equities to 20% bonds.
How do your returns stack up?
Everyone should benchmark their personal returns. Of course, if you have an advisor and are invested in high-fee mutual funds your returns are likely waaaaay behind. Remember: Canadians should avoid most mutual funds.
The shift to ETFs and asset allocation ETFs can be a life-changing move. Consider it. High fees are a wealth destroyer. Use the Contact Dale form on this page if you want to know how to make that happen. And if you want low-fee global ETF portfolios, advice and financial planning …
If you’re a self-directed investor you should also benchmark (compare) your accounts to the asset allocation ETFs of the same risk level. That is, you will match the equity to bond ratios. If you’re underperforming you can discover why. Continue Reading…
The Financial Independence Retire Early (FIRE) community is a very supportive and tight-knit one. One thing I appreciate from the diverse FIRE community is that there are people ahead of us who are always willing to share their knowledge and help others slightly behind them on the FIRE journey.
I would like to welcome Mark McGrath, CFP and CIM, who entered the world of semi-retirement on April 30. Before semi-retirement, Mark worked as a financial planner and associate portfolio manager at PWL Capital Inc. Based in Squamish, BC, Mark has been helping Canadian physicians, small business owners, and high-net-worth families on their financial decisions about portfolio management, retirement planning, tax planning, estate planning, and risk management. If you like the Rational Reminder podcast, Mark is one of the regular contributors as well.
Q1: Hello Mark, welcome to this little blog of mine. Can you tell us a little bit about yourself?
Mark McGraff, CFP (Linked In)
Thanks Bob!
I’ve been a financial planner for the past 15 years or so, and have worked primarily with physicians and their families. My most recent role was as a Financial Planner and Associate Portfolio Manager for PWL Capital, and as of May 1st I’ve decided to semi-retire and step away from full-time employment.
In 2022 I started creating educational financial content, writing mostly on Twitter and LinkedIn. I’m a huge advocate for basic financial literacy and getting the big things right, and while I occasionally write about more complex topics, a lot of my content is focused on those core basics like index funds, using your RRSP and TFSA, getting insurance in place, etc.
Outside of work, I spend most of my time with my wife and two young children, and I enjoy reading, playing strategy games, listening to music, and playing the guitar. We like to travel as well but haven’t had much time for that over the past few years, but hopefully that changes now that I have more free time.
Q2. Congrats on your semi-retirement! You mentioned that financial planning is more than spreadsheets, retirement projections, and optimal portfolios, it’s really about helping people find and fund a good life. What is your definition of a “good life?” Explain why it’s important to focus on having a good life rather than spreadsheets and projections.
Having worked with hundreds of Canadians of varying ages and backgrounds, I’ve realized that many of us never really decide what a good life is for us. We follow the traditional path – go to school, work your whole life, and retire at 65 – without pausing along the way to reflect on what’s important. Retirement can end up being very anti-climactic as a result, and those who haven’t prepared mentally and emotionally can find themselves lost. I saw this happen with my own father, unfortunately, and have spoken to literally hundreds of people who know someone who has gone through something similar.
I recently had this conversation with a 66-year-old professional client of mine, who was having what he called an identity crisis: he had worked hard for decades, amassed a small fortune, sent his kids through university, and was now unsure about what he was supposed to do with his life. Designing a good life, intentionally and earlier on in his career, may have led him to optimize his time more instead of his wealth. Avoiding this type of regret is a big impetus for my decision to semi-retire.
A good life means different things to different people, of course. For us, it means optimizing the use of these precious years with our young children while we have the energy to do it, and while they still want to hang out with us. My kids are 7 and 2, and growing up fast. I still love financial planning, and likely always will, but we wanted to design our lives so that I could engage in that on my own time, at our own pace.
For me, that means more writing and creating educational content, and likely taking on a select number of clients on a fee-only, advice-only basis. If I can do that successfully, it also means I can do it from anywhere in the world, so we plan on travelling extensively as well. My wife is a systems and industrial engineer specializing in supply chain management and data analytics. She’s basically a math and data nerd. She stepped away from work about 4 years ago to be a full-time mom, but she also wants to find a way to put her skills to use on her own terms.
Q3. It was not easy to walk away from PWL and reach the decision on semi-retirement. Walk me through how you and your wife reached the decision.
The genesis of this idea came over Christmas in 2023. My wife is from Mexico, and most of her family, including her parents, still live there. We try to visit them twice a year. Her sister Tamara, and her sister’s husband Fernando, moved to Sweden for work four years ago and joined us in Mexico for Christmas that year. Fernando’s hobby is photography, and he was showing us pictures of all the amazing places in Europe they’ve visited since moving to Sweden. My wife and I kept joking that we should just retire and travel as well.
Over the next 15 months or so, that joke kept coming up, and we realized neither of us was really joking. The more seriously we looked at it, the more apparent it became that we had to do it. At first I had planned to see if PWL would let me be a digital nomad, but we quickly shot the idea down – working full time, but just in a different country wouldn’t do – we wouldn’t have control of our time, and would be dealing with different time zones, potentially making work even harder. PWL is an incredible firm with incredible people, and it was really my dream job. At first, I thought I might be crazy for leaving. But I eventually realized I would be crazy to stay.
Being a financial planner I’ve always had a good head for our own personal finances. We saved as much as we could, and I’ve largely used index funds for the past decade. We got lucky a few times in the housing market as well, so our finances were in good shape. That obviously made the decision viable in the first place. That said, I tried not to overthink this decision from a financial perspective. I didn’t model a hundred different scenarios or anything like that.
Knowing that each of us can find a way to generate income if needed, and that we have a decent sized portfolio, was enough analysis for us on that front. Most of the decision making process was a discussion about the non-financial aspects of retirement – purpose, identity, how we want to spend our time, the benefit of being there for our children, etc.
Tawcan: Interesting that your sister-in-law and brother-in-law inspired you on the early retirement idea.
Q4. Tell me more about your plans for the new chapter of your life.
This summer we’re going to travel Europe, primarily Spain. I plan to fully disconnect from work over that time period and reassess in the fall. I do really like writing and creating educational financial content, so I’m going to focus more on that when we return, though I’m not exactly sure what that looks like yet. Likely a blog at least, perhaps another book or two in the future. I’ve wanted to get into video for some time now, so maybe a YouTube channel at some point.
Other than that, I plan to provide advice-only financial planning, but not full-time. I’m fortunate that I’ve built up a social media audience and an incredible network of other financial professionals, so generating an income this way likely won’t be a challenge for me. So I’ll do that as a way to stay engaged in the planning community and bring in a few bucks to pay the bills as needed. Continue Reading…
What most people don’t know is that when I first pitched my book idea to my publisher, its original title was More Than Money.
I thought it expressed everything I wanted to say about how most people’s financial struggles went well beyond a lack of money or financial literacy. After more than a decade of discussing money with people from all walks of life as a content creator and helping individuals and couples with their finances as a Certified Financial Counsellor, I saw firsthand how money was rarely the root cause of their financial troubles. Unfortunately, I wasn’t the only person who thought it was a good title. On my last count, there are already five books on Amazon using that same name.
It’s about Everything but Money
It wasn’t until two months after I handed in my manuscript that I finally landed on the right title for my book: Everything but Money. I think it took me that long because I needed to go on a well-overdue journey of self-discovery while writing my book and come to the realization that my own struggles with money have always been about everything but money. Through countless hours of research, interviews, and therapy, I had to face the fact that as a money expert whose job it is to educate people about their finances, my relationship with money was downright toxic.
My Toxic Relationship with Money
At first, I was ashamed. I’m supposed to be the expert here, which should mean I’m a role model and have my stuff together. Although it may look that way on a balance sheet, on the inside, I was an anxious mess who never felt good enough, no matter how much I earned or had in the bank. The real reason I dove head-first into the personal finance space as a young blogger in 2011 was that subconsciously, I thought money would be the solution to all of my unhealed emotional wounds. The unhealthy friendships that damaged my spirit growing up. The middle child syndrome that made me feel invisible. The intense pressure I put on myself to be seen and heard through external validation.
Don’t confuse Money for Happiness (but it can help)
But as I discovered while writing the book, money isn’t some magical cure-all. There’s a reason there are so many miserable millionaires and billionaires out there. Although research shows that money can increase your happiness (to a limit), research also shows it cannot fix your unhappiness. I mean, have you seen Succession? Continue Reading…
Canadian investors have increasingly been turning to all-in-one ETF solutions that offer built-in diversification and periodic rebalancing. BMO is proud to deliver on our commitment to make our Asset Allocation ETFs even more accessible to Canadian investors. To deliver even greater value, we recently announced a reduction to the annual management fee from 0.18% to 0.15% for our most popular Asset Allocation ETFs.
Now we’re Splitting to serve you Better
It’s important for us to continually evolve and support Canadian investors in reaching their unique financial goals.
With lower fees, and now, a stock split beginning on August 18, you can put more of your money to work in the portfolio that fits you best. Stock splits reduce the price per unit, making it easier to invest smaller amounts, rebalance with precision, and build diversified portfolios over time.
This change was inspired by feedback from our do-it-yourself investors and reflects our ongoing commitment to offering one of the lowest-cost, most accessible all-in-one ETF solutions in Canada.
Q: What is a stock split in the context of an ETF?
A stock split occurs when an ETF increases the number of its units outstanding by issuing additional units to existing unitholders. In a 3-for-1 split, each unitholder receives two additional units for every unit they already own: tripling the number of units while reducing the price per unit to one-third of its original value. This makes it easier to invest smaller amounts and manage portfolios with greater precision.
Q: Does a stock split change the value of my investment?
No, a stock split does not change the total dollar value of your investment. If you owned 10 shares at $90 each before a 3-for-1 split, you would own 30 shares at $30 each after the split.
The total value remains $900.
Q: Why do ETF providers do stock splits?
Stock splits are typically done to:
Lower the Net Asset Value (NAV) per unit, making the ETF more affordable and accessible to a broader range of investors.
Improve liquidity by increasing the number of units available for trading.
Encourage participation from newer or smaller investors who may be deterred by high unit prices.
Q: What are the benefits of a lower NAV for investors?
Affordability: Lower NAVs make it easier for investors to buy full units without needing large amounts of capital. Continue Reading…
The “Dogs of the TSX” dividend investing strategy for Canadian stocks has been a focus of mine for the past 13 years. I don’t follow the “Dogs” strategy with 100% of my portfolio, but it is a key factor when I look at my relative weighting of Canadian stocks at the end of each year.
I want to make it clear that the Dogs of the TSX is not something that I created. In fact, it’s actually an American idea. Michael B. O’Higgins wrote a book called the Dogs of the Dow back in 1991, and the idea was later adapted to the Canadian market. I first came across the “Dogs” method of stock picking when MoneySaver magazine started a column titled BTTSX – short for Beating the TSX – dividend stock strategy.(Click here to skip directly to my 2025 picks).
The theory behind the Dogs of the TSX strategy is to look for solid cash-flow positive stocks that have fallen out of favour for one reason or another. In other words, you’re looking to take advantage of short-term market inefficiency when it comes to the pricing of blue-chip Canadian stocks.
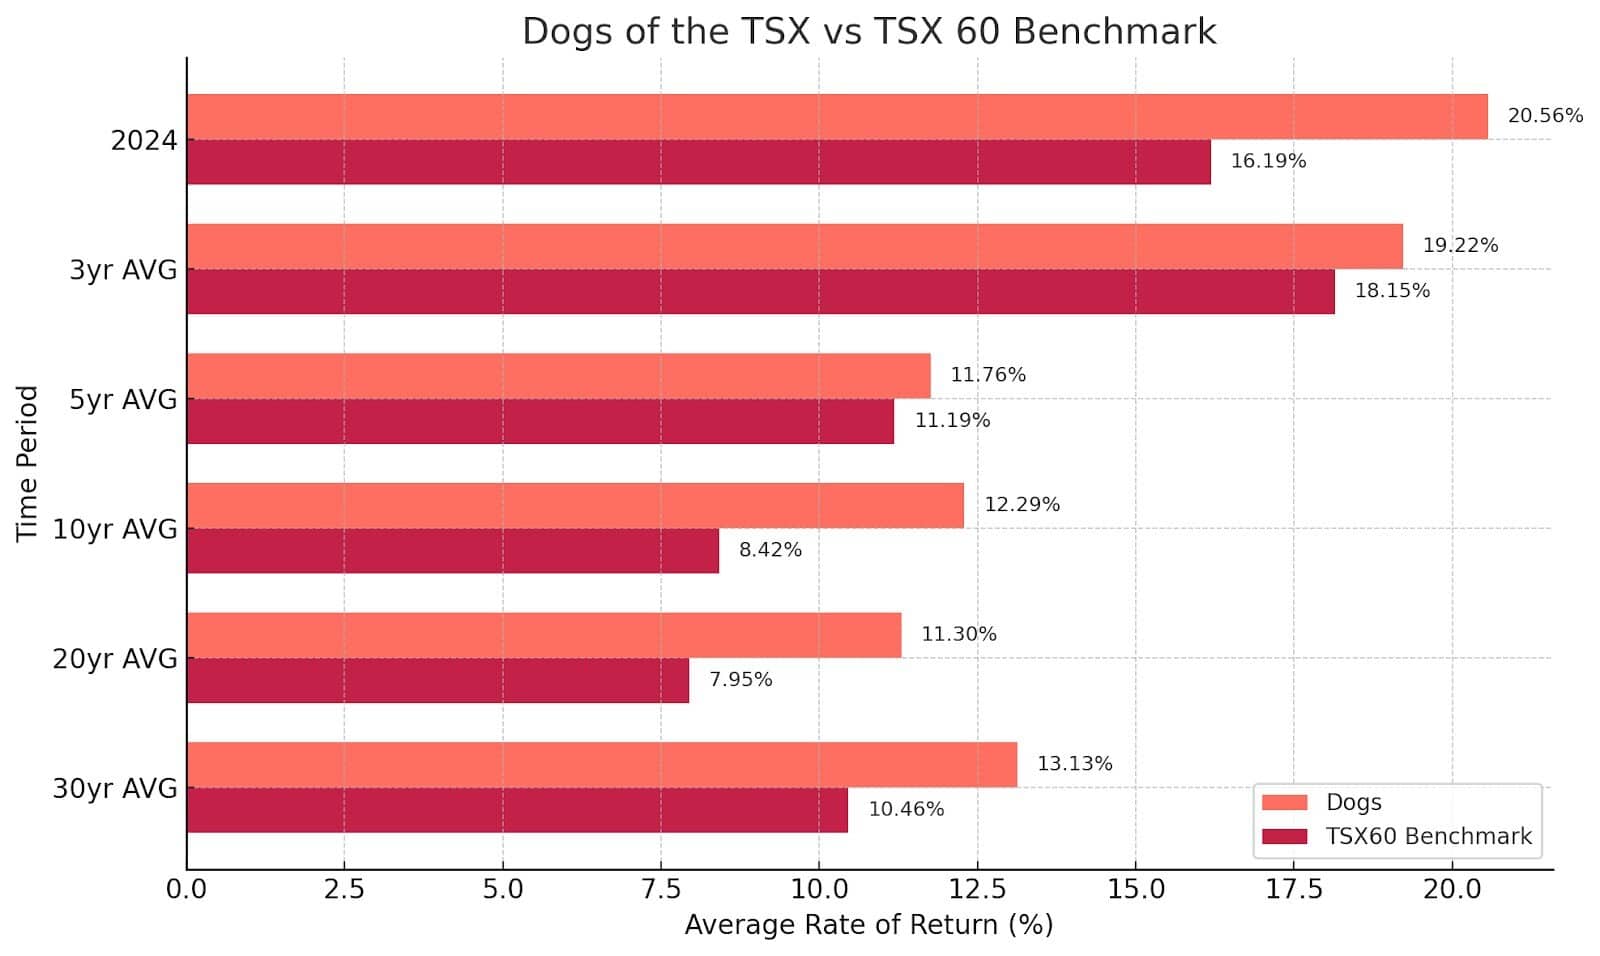
While the Dogs of the TSX investments finished 2024 a little over 3% behind the overall TSX 60 index, if we go back to 2022, the 3-yr performance favours the BTTSX stocks. If we go back even further, we can see that over the last three decades, the Dogs of the TSX stock-picking strategy has outperformed the average of the TSX 60 once by about 2.6% annually. All numbers include dividends in overall returns.
If you had $100,000 invested 30 years ago, the constant difference in compounding would have left you about $2 million richer today had you followed the Dogs of the TSX BTTSX strategy.
The highlights for “Dogs 2024” included pipelines being much more profitable than many feared, with Enbridge and TC Energy having excellent years up about 28% and 42% respectively. The other big winner was unloved bank CIBC: which had been a perennial underperformer for quite a long time (exactly the type of company that the Dogs strategy is meant to systematically select).
The laggards included Algonquin (which continued its freefall), Bell, and Telus, which all saw substantial losses in a real bull market of a year.
In its pure original form, the Dogs the TSX strategy simply involved ranking the companies in the Toronto Stock Exchange 60 index (aka: TSX 60) by their dividend yield. The highest yield gets the top spot. Then you simply choose to invest equal amounts in all ten stocks. Continue Reading…


 Posted By