Well, readers of this site will know I’m a big fan of companies that reward shareholders with dividends.
And why not love dividends?
Although I use a few indexed products in my investment portfolio, for extra diversification just in case, getting paid on a consistent, growing basis from Canadian and U.S. stocks: that’s a beautiful thing. I got another raise this week that I’ll link to below!
Digging deeper, I’m not that worried about the markets or inflation right now. There is a reason why dividends matter to me. Why do dividends really matter?
Beyond the Canadian dividend tax credit, beyond consistent payments and ever growing income I’ve experienced to date, dividends help me stick to my plan.
There is no financial advisor in my plan, nor fees paid to any advisor in my plan.
There is no day trading, there are no wasted fees or losses for trading.
There is no wild market speculation, I’m not trying to time anything.
I focus on my savings rate for investing and I invest more money when I have it. It’s that simple.
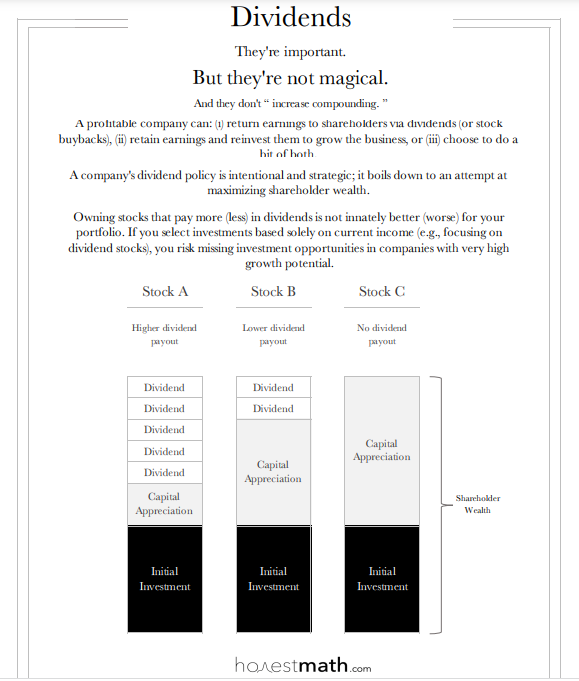
Recall that dividends paid is real money paid from real company profits. Buying and holding an established company that has paid dividends for decades is a good sign (at least from a historical perspective) that this company had enough cashflow to reward shareholders and stay in business.
Companies that don’t pay dividends tend to use their money for other means, grow their business; make acquisitions or buy back shares, pay down risky debt, therefore driving the stock price higher over time.
These are not poor management decisions by any means: far from it. There are lots of ways shareholder value is created and to be honest, acquisitions, share buybacks and other company reinvestments could be better company decisions in the long-run!!
When it comes to the capital gains versus dividend income debate, there really isn’t a debate to be had, since every dollar you earn in capital gains from a stock is worth just as much as your dividend dollar paid. I love the graphic shown at the top of this blog.
Dividends from established companies however are paid consistently, and dividend payments might even rise over time by some, so this level of predictability can provide some financial security especially when you’re invested in a diverse portfolio of stocks.
Indexed investing, when done properly can be an efficient and low-cost way of gaining exposure to various markets. Investment vehicles such as exchange-traded funds (ETFs), make it possible for individuals to invest in these indexes, i.e., the Nasdaq-100 index.
Nasdaq-100 & Exposures
Launched in 1985, the Nasdaq-100 is one of the world’s most well-known large-cap growth indexes. The companies in the Nasdaq-100 include over 100 of the largest domestic and international non-financial companies listed on the Nasdaq Stock Market based on market capitalization. It is mainly comprised of technology, consumer, and health companies – with a slight exposure to industrials and telecom.
When looking at what is powering economic growth in the 21st century, we look to those new economy sectors that are highly digital. These are disproportionately tech or consumer companies like Amazon, Microsoft, and Google. This index gives you exposure to the biggest Nasdaq-listed names, along with others that follow closely behind these leaders in technology.
Nasdaq-100 vs S&P 500 Volatility & Performance
When looking at volatility, one may think of the Nasdaq as being a more growth-oriented index, and if looking at returns alone, these have certainly shown to be significant over the years. Investors may assume that the indexes’ higher performance leads to higher volatility compared to other leading indexes. However, if we take a look at the chart below, which is more of a longer-term picture, you are getting a pretty significant consistent volatility range. Of course, if you look at this year in comparison inflation has been at the forefront of headlines, growth-oriented companies have been taking a harder hit than more cash-up-front companies: you see more volatility in the Nasdaq this year vs the S&P 500.
Both the Nasdaq-100 and the S&P 500 have had very similar volatility over last 15+ years
Index returns do not reflect transactions costs or the deduction of other fees and expenses and it is not possible to invest directly in an Index. Past performance is not indicative of future results.
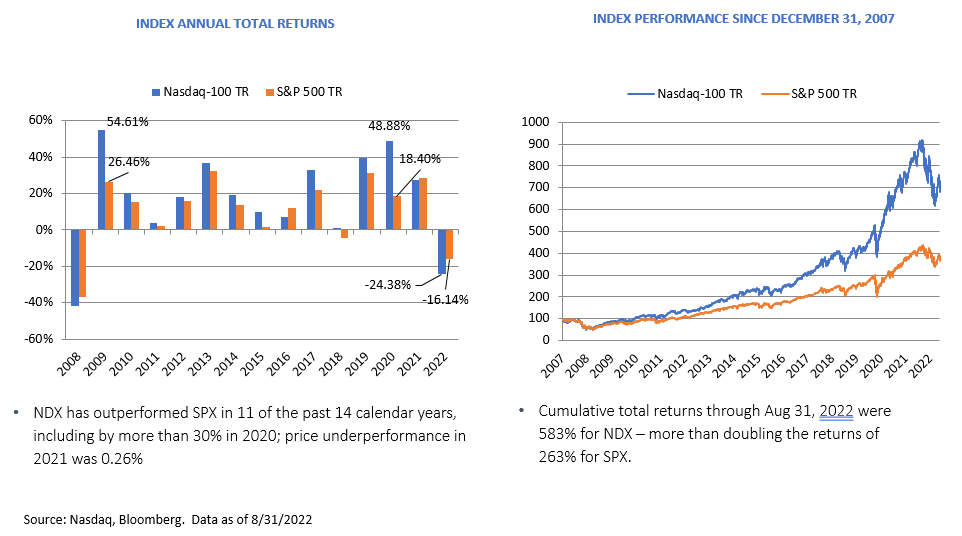
The big story for everyone is the performance of the Nasdaq-100 vs. the S&P 500. The long-term performance of the Nasdaq-100 shows an upward trend. If we look at post-2008, generally monetary policy had been very supportive of market growth, and companies had been able to invest in research, helping them grow over time. You see this reflected in the Nasdaq-100, where thanks to the underlying companies in this index, there is outperformance. The chart below showcases this quite well. It tells us that the Nasdaq-100 is a valuable holding in a portfolio based on performance.
Index returns do not reflect transactions costs or the deduction of other fees and expenses and it is not possible to invest directly in an Index. Past performance is not indicative of future results.
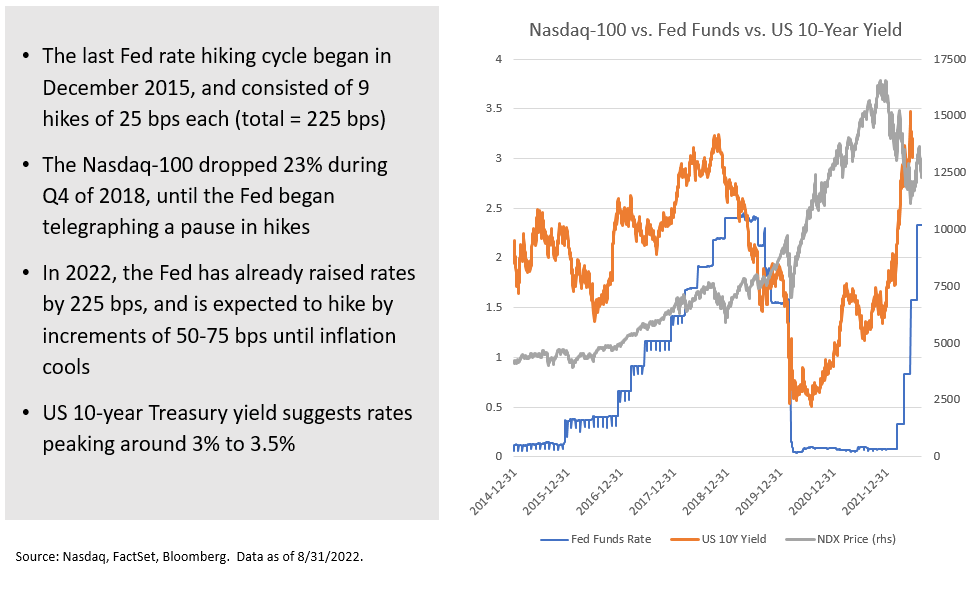
Market Considerations: Performance vs Interest Rates
The chart below shows what happened the last time rates went up by a similar amount. You can see a gradual stairway up from almost 0% to about 2.5%. You can see the dip in the NDX price (grey line), which looks like a blip, almost not noticeable (but it was 23%). This isn’t very far from the drawdown this year to date. Albeit the Fed is raising rates much faster.
Based on experience, the Fed may keep rates high until inflation gets under control into that sort of two to three per cent range. The question for investors is, what happens to stocks if rates get to 3%, 4% or maybe 5% and perhaps stay at that level for a few years? This is where it is imperative to look at the amount of debt these companies have on their balance sheet, how much the interest costs will go up and what their earnings power looks like. Will they be able to remain competitive with the price of everything rising? Will consumers continue to pay for these products vs. downsizing or even substituting for cheaper alternatives? Continue Reading…
This guest blog is excerpted from Moshe Milevsky’s recently published book, How to Build a Modern Tontine
By Prof. Moshe A. Milevsky, Ph.D.
Special to the Financial Independence Hub
I have been asked about the difference between a tontine – be it modern or medieval – and a conventional life annuity, purchased from a regulated life insurance company. Both might appear to perform similar tasks at first glance, but the differences are subtle and important and get to the essence of the distinction between longevity insurance versus longevity (or survivorship) credits.
One aspect of the life annuity story is the financial benefit of risk pooling, and the other is the insurance benefit and comfort from having a guaranteed income that you can’t outlive. Allow me to elaborate with a statement that some readers might find shocking. If you are 75 years old with $100,000 in your RRIF and would like to guarantee a fixed annual income for the rest of your life, there is absolutely no need to purchase a life annuity from an insurance company to achieve that goal. There are other options.
This might sound like something odd for a long-term annuity advocate to say. But the fact is that a non-insurance financial advisor can design a lovely portfolio of zero-coupon strip bonds that will do the job. That collection of bonds will generate $4,000 per year for the rest of your life, even if you reach the grand old age of 115. Ok, financial advisors need to eat too, so they may not do it for $100,000, but I’m sure that a lump sum of $1,000,000 will pique their interest and in exchange you will get $40,000 per year.
Moreover, with these strips, if you don’t make it all the way to the astonishing age of 115, they will continue to send those $4,000 (or $40K) to your spouse, children or favourite charity until the date you would have reached 115, if you had been alive. This collection of strips would be completely liquid, tradeable and fully reversable, although subject to the vagaries of bond market rates. For this I have assumed a conservative, safe and constant 2.5% discount rate across the entire yield curve, which isn’t entirely unreasonable in today’s increasing environment.
Stated technically, the present value of the $4,000 annual payments, for the 40 years between your current age 75 and your maximum age 115, is exactly equal to $100,000 when discounted at 2.5%. Yes, those numbers and ages were deliberately selected so my numerical example rhymes with the infamous 4% rule of retirement planning but has absolutely nothing to do with it.
Now, I’m sure you must now be thinking (or even yelling) “Moshe, but what if you live beyond age 115, eh? You will run out of money!”
Touché. Let’s unpack that common knee-jerk reaction to non-insurance solutions for a moment. To start with, the probability of reaching age 115 is ridiculously and unquantifiably low. If you do happen to be the one in a 100 million (or perhaps billion) that reaches age 115, I suspect you will have other things on your murky mind. Personally and post-covid, there is a very long list of hazards that worries me more than hitting 115.
Nobody really “runs out of money” in this century
Second and more importantly, nobody really “runs out of money” in retirement in the 21st century. That is plain utter fear-mongering nonsense. With CPP, OAS/GIS, the elderly will continue to receive some income for as long as they live even if they have completely emptied every piggy bank on their personal balance sheet. In fact, with tax-based means-testing you might get more benefits if you actually do empty your bank accounts.
Ok, so back to my prior claim and the supporting numbers, if you want a guaranteed (liquid, reversable, bequeathable) income for the rest of your life, you can exchange your $100,000 for a bunch of strip bonds and voila, you have created a sort of pension plan. My point here is that the primary objective isn’t a guaranteed lifetime of income: which anyone can create with a simple discount brokerage account and a DIY instruction manual. Continue Reading…
By Kim Catechis, Investment Strategist, Franklin Templeton Institute
and Andrew Buntain, Institutional Portfolio Manager,
Franklin Bissett Investment Management
(Sponsor Content)
The world is living in volatile times.
East-West geopolitical tensions, which had been building even before the COVID-19 pandemic upended the lives of millions around the globe, have exploded into war in Europe. The Russia/Ukraine conflict is now well into its sixth month, with no end in sight. Severe sanctions disconnecting Russia from the West are structural and unlikely to be removed even after the conflict is resolved.
There are real consequences for the world from this conflict. Ukraine’s economy has been ravaged. Europe is back to having a militarized border. NATO has grown stronger and is spending on defence; more than 2% of Gross Domestic Product (GDP) is expected to be allocated to military expenses by member nations. Supply chain disruptions have been exacerbated by the upheaval, with an energy crisis in Europe, fears of famine in Africa, shortages of critical products in many industries and the highest inflation levels in over 40 years.
Growth expectations are falling on the growing realization that central banks are not well placed to deal with food price and energy inflation, despite aggressive policy rate hikes. In many countries, including Canada, fears of recession have replaced fears of overheated economies.
Higher commodity prices a boon for producer nations
Prices for the world’s basic commodities — energy, food, metals and minerals, forest products — soared in the first half of the year. In recent months, they have fallen somewhat but remain high, and this situation is likely to continue. Trade patterns in place for 49 years have been destroyed, and new alliances and infrastructure take time to build. As with any change, there will be winners and losers. For commodity producers like Canada, the evolving dynamics open doors to new opportunities.
Energy hits critical mass
Europe has gone on a buyers’ strike against Russia. In response, Russia is turning off the fossil fuel taps. While not a huge obstacle to oil procurement (there is plenty of oil in the world), natural gas is another matter. Russia controls 30% of the world’s natural gas reserves, and all but one of its gas pipelines go to western Europe.
Filling the huge supply gap left by Russia presents a once-in-a-lifetime opportunity for other producers to capture market share in one of the world’s most profitable regions; however, the lack of pipelines to other natural gas-producing regions means that liquid natural gas (LNG) must be transported by ship.
Largely because of transport costs, nearby producers with spare capacity like Qatar, Algeria, and Nigeria, will likely be the winners rather than Canada. In any case, Canada still benefits from the cascading effect of higher fuel prices. In the meantime, close to 20 projects have been proposed in Canada to export LNG through both coasts. Without doubt, there will be other opportunities.
“E” is for environmental backlash
As winter approaches and energy concerns grow, concerns have arisen that attractive prices and the renewed drive to obtain reliable fossil fuel supplies will set back efforts to combat climate change. For Europeans, there is no alternative to ESG; the “green deal” already in place prior to the war has been accelerated. Concurrently, however, a strong view is building that the definition of ESG needs to evolve, with many preferring “sustainability” and a focus on inclusion, rather than the exclusion often associated with ESG.
Overall, Canada’s oil and gas extraction and refining methods are considered very environmentally friendly. One example is a long-time holding in the Franklin Bissett portfolios, ARC Resources Ltd. Rather than pay others to dispose of wastewater from the drilling process, the company’s Montney operation recycles and reuses the water.
The other two letters in ESG — “S” for social and “G” for governance — should not be ignored. In an era where enormous value is being placed on reliability, a stable workforce and good corporate governance have become at least as important as efficiency. Under these criteria as well, Canada performs better than most; the Canadian oil and gas industry is recognized globally for strong social progress and governance metrics.
Agriculture: food for thought
The global response to threats of food shortages has been to advocate opening up more land for crops, but the planet has a limited amount of cropland. Significantly, almost half of the grains produced worldwide are used for animal feed, which people then consume indirectly by eating meat. In Europe, we are seeing an increase in vegetarianism; if meat consumption were to decline further because of the current situation, it could potentially lead to new patterns of behaviour that imply lower demand for animal feed. Elsewhere, food insecurity is growing, especially across Africa.
Ukraine is a major producer of sunflower oils, barley and maize (corn). Grain prices peaked in June as the United Nations struck a deal to allow some Ukraine grain shipments from Mariupol, but there is no guarantee it will continue. In countries most at risk of shortages from the disruptions, such as Nigeria and Bangladesh, people already tend to pay the largest proportion of their budgets for food. Turkey and Egypt are also very exposed to Russian wheat and have little reserve stock. Continue Reading…
As we update our list of the Best Canadian Dividend Stocks for 2022, we continue to focus on four key areas:
Dividend Yield
Dividend Growth Consistency
Earnings Per Share
Overall Company Revenues
As we head into Q3, Canadian dividend stocks have continued to reward our confidence in them. While high-flying tech stocks have gotten slaughtered (and then recovered a little bit), and European stocks continue to see their growth evaporate, Canadian oligopolies continue to churn out dependable dividend growth. With Canadian forward P/E now at 12 – well below their historical average of 14 – there is no better place to be in terms of equity exposure if you prize caution and dividend yield.
While they have suffered drawdowns at times due to market-wide momentum, they have held up quite well, and earnings reports have supported the long-term viability of their dividends.
While many companies around the world are seeing their bottom lines chewed up by increasing costs, our top Canadian dividend stocks continue to show the pricing power that made us so confident in recommending them in the first place.
As a longtime dividend investor (I’ve had a Canadian dividend investing portfolio for over 15 years now, since I started the Smith Manoeuvre) I’ve learned that while current dividend yield is a beautiful thing, it’s the long-term dividend growth and earnings per share (EPS) that will really drive your overall portfolio returns.
My personal selection for the top dividend stocks for long-term investments are available below.
Our Top 10 Canadian Dividend Growth Stocks (September 2022)
Here’s a look at our top 10 long-term Canadian dividend stocks in order of their dividend increase streak.
For my full 32-stock list of Canadian dividend earners that I’m buying today – as well as the 74-stock list of US Dividend all stars that I recommend – check out the platform that I personally use to do my dividend stock research.
Note: Data on this article updates periodically. If you are looking for real time data and guidance, read our recommendation below.
More Up to Date Canadian Dividend Stocks Data
The easiest way to keep up to date with the best dividend stock picks, is by signing up with Dividend Stock Rock. DSR is not just a weekly newsletter with stock picks. It’s a program that will help you manage your portfolio and improve results using unique and sophisticated tools.
The person behind DSR is Mike, the most prominent and active dividend stock blogger in Canada and is a certified financial planner since 2003.
You can first read our detailed DSR review, or sign up now by clicking the button below. Our readers are eligible for an exclusive 33% off discount using code MDJ33.
Visit DSR & Get Exclusive Discount
2022 Canadian Dividend Update
The war in Ukraine has shaken markets around the world, and with the word “recession” appearing every two paragraphs in most financial publications, people have pulled money out of markets to some degree. (Although perhaps not as much as the initial “meltdown skeptics” initially anticipated.)
This has resulted in some stocks seeing their valuations get beat up despite actually increasing both their revenues and operating profits. You can see from the chart below for example that Canadian banks stocks just continue to print free cash flow and increase dividends at a safe (but lucrative) rate.
Given their very attractive current valuations, you’d have to expect a recession to crater their earnings by 20%+ for this to make sense – and I just don’t see that happening.
Bank
Dividend Increase
EPS
2017 Dividend
2021 Dividend
2022 Dividend
Payout Ratio
BMO.TO
25.47%
53.28%
$0.88
$1.06
$1.33
36.56%
NA.TO
22.54%
57.29%
$0.56
$0.71
$0.87
31.37%
TD.TO
12.66%
20.06%
$0.55
$0.79
$0.89
40.86%
RY.TO
11.11%
41.39%
$0.83
$1.08
$1.20
39.02%
BNS.TO
11.11%
45.30%
$0.76
$0.90
$1.00
46.54%
CM.TO
10.27%
69.38%
$1.27
$1.46
$1.61
41.81%
With payout ratios like the ones above, combined with those really solid Earnings Per Share numbers – we remain strong in our belief that there are no better options for investors who want stable long-term growth combined with free cash flow.
With inflation fears now dominating the media news cycle, we see more than ever that companies with solid balance sheets and oligopoly-driven moat stocks are the smart long-term play. Companies that can pass along those inflation-fuelled rise in costs have historically outperformed during inflation cycles.
Frankly, I think all of this talk about inflation might be a bit overdone, and that it’s likely to come down to the 3-3.5% range next year. At that rate, it’s really only a mild concern in the grand scheme of things. I’d be much more worried if this was deflation we were talking about!
Our list of top Canadian inflation stocks explains exactly which companies we believe are best positioned in order to pass along the inevitable price increases and increased costs that will come along in 2022.
Of course we remain committed to our long-term strategy of balancing EPS with a company’s ability to grow its dividend, in order to allocate our personal dividend nest egg.
Afterall, the only thing better than a high dividend yield today, is a much larger (and increasing) one tomorrow!
Check out our in-depth Dividend Stocks Rock Review for a deeper dive on just why we trust the service so much, and more details on our exclusive promo offer code.
My Top Canadian Dividend Stock Recommendations
Sorted in order of dividend streak:
Fortis (FTS.TO) – 48 Years of Dividend Growth
3.67% Dividend Yield
6.68% 5 Year Revenue Growth
6.10% 5 Year Dividend Growth
79.85% Payout Ratio
22.06 P/E
Investment Thesis:
Fortis aggressively invested over the past few years resulting in strong and solid growth from its core business. You can expect FTS’s revenues to continue to grow as it continues to expand. Strong from its Canadian based businesses, the company has generated sustainable cash flows leading to four decades of dividend payments.
The company has a five-year capital investment plan of approximately $19.6 billion for the period 2021 through 2025. Only 33% of its CAPEX plan will be financed through debt. Nearly two-thirds will come from cash from operations. Chances are most of its acquisitions will happen in the US.
We also like the FTS goal of increasing its exposure to renewable energy from 2% of its assets in 2019 to 7% in 2035. The FTS yield isn’t impressive at around 3.70%, but there is a price to pay for such a high-quality dividend grower.
Dividend Growth Perspective:
Management increased its dividend 6% in 2019 and 2020 and has declared that it expects to increase dividends by 6% annually until 2025. We like it when companies show motivation for growth (through acquisitions) and reward shareholders at the same time!
After all, Fortis is among those rare Canadian companies who can claim it has increased its dividend for 48 consecutive years. Fortis is a great example of a “sleep well at night” stock.
Enbridge (ENB.TO) – 26 Years of Dividend Increases
6.38% Dividend Yield
6.37% 5 Year Revenue Growth
9.52% 5 Year Dividend Growth
117.23% Payout Ratio
22.30 P/E
Investment Thesis:
ENB’s customers enter 20-25-year transportation contracts. It is already well positioned to benefit from the renewed profits of the Canadian Oil Sands (as its Mainline covers 70% of Canada’s pipeline network).
As production grows, the need for ENB’s pipelines remains strong.
After the merger with Spectra, about a third of its business model will come from natural gas transportation. Enbridge has a handful of projects on the table or in development. It must deal with regulators notably for their Line 3 and Line 5 projects. Both projects are slowly but surely developing.
The cancellation of the Keystone XL pipeline (TC Energy) secures more business for ENB for its liquid pipelines. ENB has now a “greener” focus with their investments in renewable energy. The stock offers a yield over 6% which makes it a strong candidate for any retirement portfolio.
Dividend Growth Perspective:
The company has been paying dividends for the past 65 years and has 26 consecutive years with an increase. While it’s probable dividend growth won’t be as generous as compared to the past three years (10%/year), the current generous yield makes up for it. Management aims at distributing 65% of its distributable cash flow, leaving enough room for CAPEX.
Look for their latest quarterly presentation for their payout ratio calculation. Management expects distributable cash flow growth of 5-7%. Therefore, you can expect a similar dividend growth rate. We have used more conservative numbers in our DDM calculation.
Canadian National Railway (CNR.TO) – 26 Years of Dividend Increases
1.90% Dividend Yield
3.76% 5 Year Revenue Growth
10.40% 5 Year Dividend Growth
35.57% Payout Ratio
21.17 P/E
Investment Thesis:
Canadian National has been known for being the “best-in-class” for operating ratios for many years. CNR has continuously worked on improving its margins. The company also owns unmatched quality railroads assets.
CNR has a very strong economic moat as railways are virtually impossible to replicate. Therefore, you can count on increasing cash flows each year. Plus, there isn’t any more efficient way to transport commodities than by train. The good thing about CNR is that you can always wait for a down cycle to pick up some shares. There’s always a good occasion around the corner when we look at railroads as attractive investments.
Finally, the cancellation of the Keystone XL pipeline has driven more oil transportation toward railroads. CNR has benefitted from this tailwind.
In 2021 CNR entered a bidding war against CP to buy the Kansas City Southern Railroad. When the deal fell through for CNR, and the company announced a renewed focus on efficiency, long-term investors were rewarded handsomely as the stock shot up in value.
Dividend Growth Perspective:
CNR has successfully increased its dividend yearly since 1996. The management team makes sure to use a good part of its cash flow to maintain and improve railways, all while rewarding shareholders with generous dividend payments.
CNR shows impressive dividend records with very low payout ratios. While the business could face headwinds from time to time, its dividend payment will not be affected. Shareholders can expect more high-single-digit dividend increases.
Telus (T.TO) – 18 Years of Dividend Increases
4.58% Dividend Yield
5.76% 5 Year Revenue Growth
6.68% 5 Year Dividend Growth
103.38% Payout Ratio
22.10 P/E
Investment Thesis:
Telus has grown its revenues, earnings, and dividend payouts on a very consistent basis. It is very strong in the wireless industry and is now attacking other growth vectors such as the internet and television services.
The company has the best customer service in the wireless industry as defined by their low churn rate. It uses its core business to cross-sell its wireline services. Telus is particularly strong in Western Canada, but has the recent Rogers turmoil to increase market share throughout the country.
Telus is well-positioned to surf the 5G technology tailwind. This Canadian telecom stalwart looks at original (and profitable) ways to diversify its business. Telus Health, Telus Agriculture and Telus International (artificial intelligence) (TIXT.TO) are small, but emerging divisions that should lead to more growth going forward.
Dividend Growth Perspective:
This Canadian Aristocrat is by far the industry’s best long-term dividend-payer (as opposed to short-term yield). Telus has a high cash payout ratio as it puts more cash into investments and capital expenditures.
Capital expenditures are always taking away significant amounts of cash due to their massive investment in broadband infrastructure and network enhancement. Such investments are crucial in this business.
Telus fills the cash flow gap with financing for now. At the same time, Telus keeps increasing its dividend twice a year showing strong confidence from management.
Emera (EMA.TO) – 15 Years of Dividend Increases
4.31% Dividend Yield
6.15% 5 Year Revenue Growth
5.24% 5 Year Dividend Growth
128.82% Payout Ratio
29.42 P/E
Investment Thesis:
Emera is a very interesting utility with a solid core business established on both sides of the border. EMA now shows $32 billion in assets and will generate annual revenues of about $6 billion. It is well established in Nova Scotia, Florida, and four Caribbean countries.
This utility is counting on several “green projects” consisting of both hydroelectric and solar plants. Between 2021 and 2023 management expects to invest $7.4 to $8.6B in new projects to drive additional growth. These investments decrease the risk of future regulations affecting its business as the world is slowly moving toward greener energy.
Most of its CAPEX plan will be deployed in Florida where Emera is already well established. In general, Florida offers a highly constructive regulatory environment. In other words, EMA shouldn’t have any problems raising rates. This is another “sleep well at night” investment.
Dividend Growth Perspective:
Emera has been increasing its dividend payments each year for over a decade. With the purchase of TECO energy management intends to continue that tradition. The company forecasts a 4-5% dividend growth rate through 2022, while targeting a payout ratio of 70-75%.
At a 4%+ dividend yield, this is a keeper for several years. Don’t get fooled by the high payout ratio, as the adjusted earnings show a payout ratio around 80% including the recent dividend growth. This is the type of company that fits perfectly in a retirement portfolio.