By Noah Solomon
Special to Financial Independence Hub
I’m just sitting on a fence
You can say I got no sense
Trying to make up my mind
Really is too horrifying
So I’m sitting on a fence
- The Rolling Stones
Benjamin Graham and David Dodd are universally regarded as the fathers of value investing. In their 1934 book “Security Analysis” they introduced the concept of comparing stock prices with earnings smoothed across multiple years. This long-term perspective dampens the effects of expansions as well as recessions. Yale Professor and Nobel Prize winner Robert Shiller later popularized Graham and Dodd’s approach with his own version, which is referred to as the cyclically adjusted price-to-earnings (CAPE) ratio.
S&P 500 CAPE Ratio: 1881- Present
Since 1881, the CAPE ratio for U.S. equities has spent about half of the time between 10 and 20, with an average and median value of about 16. Its all-time low of 5 occurred at the end of 1920, and its high point of 45 occurred at the end of 1999 during the height of the internet bubble.
What if I told you …. ?
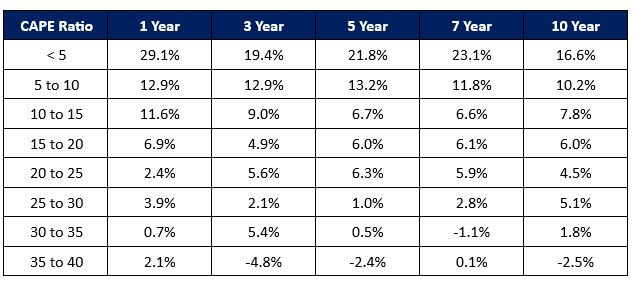
The following table shows average real (after inflation) annualized returns following various CAPE ranges.
S&P 500 Index: CAPE Ratio Ranges vs. Average Annualized Future Returns (1881 Present)
What is abundantly clear is that higher returns have tended to follow lower CAPE ratios, while lower returns (or losses) have tended to follow elevated CAPE levels. An investment strategy that entailed having above average exposure to stocks when CAPE levels were low, below average equity exposure when CAPE levels were high, and average allocations to stocks when CAPE levels were neither elevated not depressed would have resulted in both less severe losses in bear markets and higher returns over the long-term.
By no means does this imply that low CAPE ratios are always followed by periods of strong performance, nor does it imply that poor results are guaranteed following instances of elevated CAPE levels. That would be too easy!
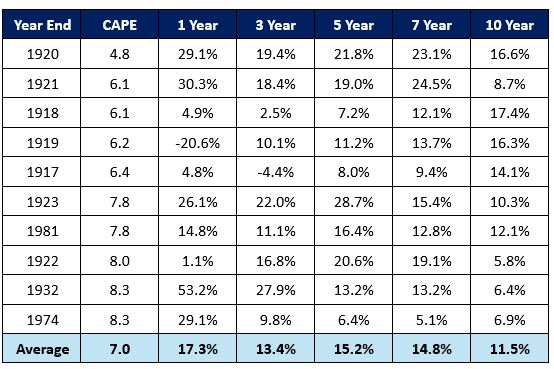
S&P 500 Index: Lowest CAPE Ratios vs. Future Real Returns (1881 – Present)
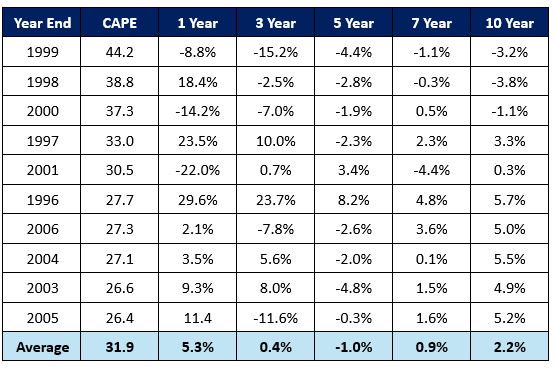
S&P 500 Index: Highest CAPE Ratios vs. Future Real Returns (1881 – Present)
Looking at the performance of stocks following extreme CAPE levels, it is clear that valuation is best used as a strategic guide rather than as a short-term timing tool. It is most useful on a time scale of several years rather than a shorter-term timing tool.
- Although there have been instances where low CAPE levels have been followed by weak performance over the next 1-3 years, there have been no instances in which average annualized returns over the next 5-10 years have not been either average or above average. While it sometimes takes time for the proverbial party to get started when CAPE levels hit abnormally depressed levels, markets have without exception performed admirably over the medium to long-term.
- Similarly, although there have been instances where high CAPE levels have been followed by strong performance over the next 1-3 years, there have been no instances in which average annualized returns over the next 5-10 years have not been either below average or negative. Whenever CAPE levels have been extremely elevated, it has only been a matter of time before the valuation reaper exacted its toll on markets. This brings to mind the following quote from Buffett:
“After a heady experience of that kind, normally sensible people drift into behavior akin to that of Cinderella at the ball. They know that overstaying the festivities — that is, continuing to speculate in companies that have gigantic valuations relative to the cash they are likely to generate in the future — will eventually bring on pumpkins and mice. But they nevertheless hate to miss a single minute of what is one helluva party. Therefore, the giddy participants all plan to leave just seconds before midnight. There’s a problem, though: They are dancing in a room in which the clocks have no hands.”
Be the House, Not the Chump
There have been (and inevitably will be) times when equities post strong returns for a limited time following elevated CAPE levels and instances where stocks post temporarily weak results following depressed CAPE levels.
However, successful investing is largely about playing the odds. If you were at a casino, wouldn’t you prefer to be the house rather than the chump on the other side of the table? Although chumps occasionally get lucky, this doesn’t change the fact that the odds aren’t in their favour and that they are playing a losing game. Over the long-term, investors who refrain from reducing their equity exposure when CAPE levels are elevated and don’t increase their allocations to stocks when CAPE levels are depressed will achieve satisfactory returns over extended periods. That being said, I sure wouldn’t recommend such a static approach for the simple reason that it involves suffering severe setbacks in bear markets and leaving a lot of money on the table over the long-term.
Given the historically powerful relationship between starting CAPE levels and subsequent returns, what if I told you that the CAPE ratio currently stands at 38, putting it at the top 98th percentile of all year-end observations going back over 150 years, and the top 96th percentile over the past 50 years? Presumably you would at the very least consider taking a more cautious stance on U.S. stocks.
Let’s Pretend ….
Let’s pretend that you knew nothing about the historical relationship between CAPE levels and subsequent returns. A combination of behavioural biases, speculative fervour, and FOMO (fear of missing out) might lead you to adopt an “if it isn’t broken, don’t fix it” stance of inertia.
Recency bias can give people a false sense of confidence that what has occurred in the recent past is “normal” and is therefore likely to continue in the future. Moreover, the strong returns which have occurred since the global financial crisis can exacerbate FOMO, thereby prompting investors to stay at the party (and perhaps even to imbibe more intensely by increasing their equity exposure). Lastly, the potential of innovative technologies such as AI to revolutionize businesses can capture investors’ imaginations and incite euphoria to the point where they believe that there is no price that is too high to pay for the unlimited profit potential of the “shiny new toy.”
Standing at the Crossroads
So here we stand at a crossroads, caught between the weight of history and the possibility that this time it may truly be different. What is an investor to do? One can never be 100% sure. The “right” answer will only be known in hindsight once it becomes a matter of record, at which point it will be too late for investors who get caught on the wrong side of the fence.
At the beginning of 2000, Microsoft and Amazon were great companies. However, notwithstanding their greatness and the fact that they proved to be very profitable long-term investments, this didn’t prevent them from suffering severe losses over the next several years. By September of 2001, Amazon stock had fallen by over 90%. It then recouped its losses by July 2007, before declining by over 40% during the global financial crisis. In Microsoft’s case, by the time it reached its low in early 2009 it had plummeted by over 65%, and did not reach its January 2000 level until July of 2014. In comparison, the equal-weighted S&P 500 Index, which was far less exposed to the TMT (technology, media, and telecom) craze of the day, fared far better in terms of both depth and length of losses, experiencing a maximum peak trough decline of approximately 30% and recouping its losses by October 2003.
In hindsight, the issue was not with the companies themselves. Over the past 25 years, they have grown their earnings at a ferocious clip and generated tremendous value for their shareholders. Rather, the problem was valuations that were unrealistic for even truly spectacular companies. As was both the case then and may very well be the case today, there is such a thing as too high a price.
When the S&P 500 Index began its largely uninterrupted run in March 2009, its CAPE ratio stood just above 13, as compared to its current level of 38, which coincidentally is where it was at the end of 2021 before markets turned ugly. Perhaps even more ominously, rates are far higher today than they were then. In essence, it will take something extraordinary for the S&P 500 to produce good returns over the next several years. Importantly, investing that requires something extraordinary to occur has historically been a bad idea, notwithstanding a small handful of exceptions.
Don’t throw the Baby out with the Bathwater
The current lofty valuation of the S&P 500 is inextricable from the mega-cap technology juggernaut that has dominated the U.S. stock market over the past decade. Given the growth and current size of these companies, they have come to assume an outsized influence on the index. Outside of these highly valued behemoths, the rest of the U.S. market is not nearly as daunting from a valuation perspective.
The equal-weighted S&P 500 Index has a far lower exposure to mega cap growth stocks and by extension more of a value bias than its better-known capitalization weight counterpart. Relatedly, the equal weighted version’s forward P/E currently stands at 19.8, representing a 21.4% discount to the capitalization weighted index’s 25.2. Similarly, given that mega cap, growth companies are a U.S.-only phenomenon, stocks in other countries and regions lie at or below their historical average valuation levels.
Warren Buffett famously said, “Price is what you pay. Value is what you get.” Over periods of years and decades it is evident that an investor’s return is heavily dependent on the price that they paid for assets. In this vein, prudent investors need not reduce their overall equity exposure but should instead be playing the proverbial odds by shifting their U.S. exposure in favour of value stocks and tilting their country exposure towards non-U.S. developed equities.
With this in mind, the Outcome Canadian and U.S. Equity income mandates, which focus on companies which have a longstanding record of consistently growing their dividends and exhibiting low volatility, are well positioned to outperform over the next several years.
 Noah Solomon is Chief Investment Officer for Outcome Metric Asset Management Limited Partnership. From 2008 to 2016, Noah was CEO and CIO of GenFund Management Inc. (formerly Genuity Fund Management), where he designed and managed data-driven, statistically-based equity funds.
Between 2002 and 2008, Noah was a proprietary trader in the equities division of Goldman Sachs, where he deployed the firm’s capital in several quantitatively-driven investment strategies. Prior to joining Goldman, Noah worked at Citibank and Lehman Brothers. Noah holds an MBA from the Wharton School of Business at the University of Pennsylvania, where he graduated as a Palmer Scholar (top 5% of graduating class). He also holds a BA from McGill University (magna cum laude).
Noah is frequently featured in the media including a regular column in the Financial Post and appearances on BNN. This blog originally appeared in the November 2024 issue of the Outcome newsletter and is republished here with permission.


Thank you so much for this balanced and logical perspective, I loved reading it!