By Erin Allen, CIM, BMO ETFs
(Sponsor Blog)
For the most part, when searching for a passive index ETF, you’ll typically encounter products that are weighted by market capitalization. In a market-cap-weighted ETF, a company’s size (calculated by multiplying its share price by the number of outstanding shares) determines how much influence it holds within the index1.
You can see this clearly in widely held U.S. equity ETFs. Take BMO S&P 500 Index ETF (ZSP) as an example. After accounting for the top 10 holdings, the remaining 490 companies make up about 59.49% of the portfolio. That means the top 10 stocks alone represent roughly 40.51% of the ETF’s total weight2.
The concentration becomes even more pronounced in indices like the Nasdaq 100 or the BMO NASDAQ 100 Equity Index ETF (ZNQ) which already has a reputation for heavy exposure to technology companies. In that case, the remaining 90 stocks together account for only 48.58% of the index, while the top 10 holdings make up over half of the entire portfolio3.
Chart 1 Compares top holdings of ZSP – BMO S&P 500 Index ETF to ZNQ – BMO NASDAQ 100 Equity Index ETF
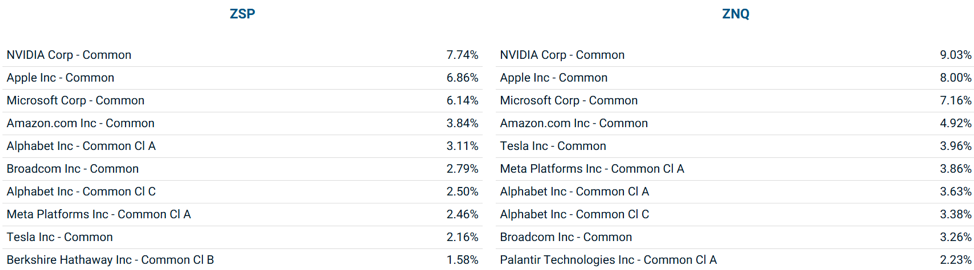
Source: BMO Global Asset Management as of January 30, 20264
Supporters of market-cap weighting say it allows winners to keep running. As a company grows and becomes more valuable, it naturally takes up more space in the index. Over long periods, this approach has benefited from the success of dominant firms that continue to compound.
At the same time, that same feature can make some investors uncomfortable. In the context of 2026, buying a broad market ETF can effectively mean committing a large share of your capital to a relatively small group of mega-cap stocks that are trading at expensive valuations.
Fortunately, the choice is not limited to market-cap weighting or sitting in cash. Equal-weight strategies offer a different way to construct an ETF. Instead of assigning weight based on size, equal-weight ETFs give each constituent the same allocation, regardless of how large or small the company is.
Understanding how these two approaches differ, along with their respective advantages and limitations, is key to choosing the structure that best fits your goals.
How Equal-Weight ETFs work
To see how equal weighting works in practice, it helps to look at a concrete example. Rather than staying in the U.S. market, consider the Canadian utilities sector and compare two different index construction methods applied to the same group of stocks.
A common benchmark is the S&P/TSX Capped Utilities Index. This index tracks 14 Canadian utility companies and weights them by market capitalization, subject to a 25% cap on any single holding.
As of January 31, 2026 the four largest holdings dominated the portfolio. Fortis accounted for 23.35% of the index. Brookfield Infrastructure Partners made up 14.47%. Emera represented 12.61%, and Hydro One came in at 10.84%. Together, those four companies made up more than 60% of the entire index.
Utilities are often viewed as defensive businesses with sensitivity to interest rates and stable cash flows. But instead of making a sector-wide allocation, most of the portfolio’s risk and return ends up tied to a small handful of companies.
An equal-weight approach produces a very different result. The Solactive Equal Weight Canadian Utilities Index holds a similar group of utility stocks, but each company is given the same weight at each rebalance. With 13 holdings, BMO Equal Weight Utilities Index ETF (ZUT)5 allocates roughly 7.7% to each stock, regardless of company size5.
The practical effect is a more balanced exposure across the sector. Smaller or mid-sized utilities receive the same attention as the largest incumbents, and portfolio outcomes are less dependent on the performance of one or two dominant names.
Equal-Weighting for U.S. Stocks
Equal weighting is not limited to Canadian sector ETFs. Entire equity markets can be constructed this way, including the U.S. market. There is a long history of data comparing the S&P 500 Total Return Index with its equal-weight counterpart – the S&P 500 Equal Weight Total Return Index .
Chart 2: Comparing the S&P 500 Total Return Index vs the S&P 500 Equal Weight Total Return Index.
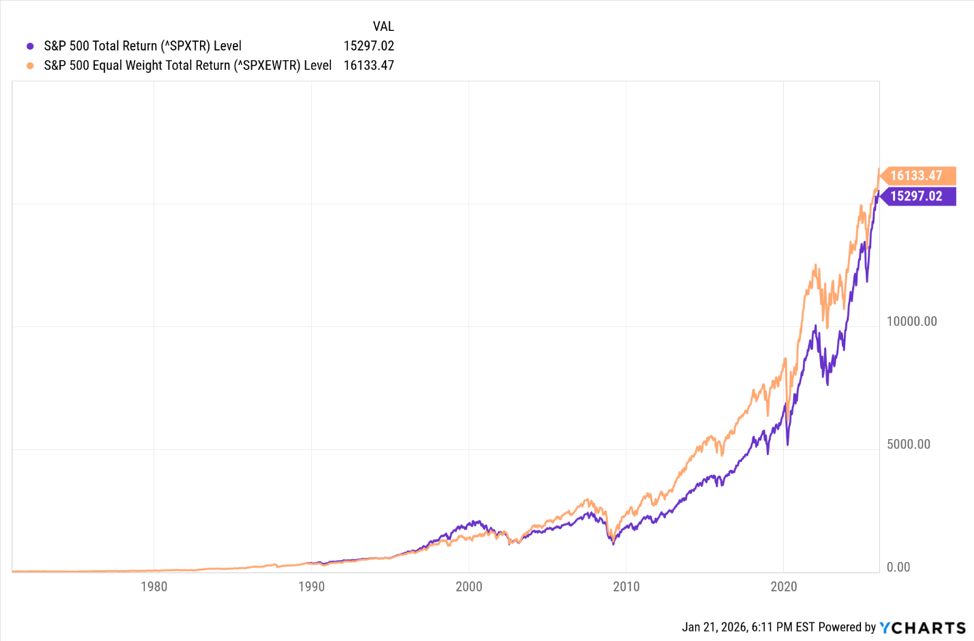
Source: YCharts, as of January 21, 20266 Index returns do not reflect transactions costs or the deduction of other fees and expenses and it is not possible to invest directly in an Index. Past performance is not indicative of future results
Over time, both versions have gone through periods of outperformance and underperformance relative to each other. But from the start of the available data through today, the equal-weight version has delivered higher cumulative returns.
That outperformance tends to show up during periods when smaller and mid-sized stocks outperform large caps.
On the downside, they are also less exposed to drawdowns driven by a small group of very large stocks at the top of the index. However, equal weighting does not have to mean owning a modified version of the S&P 500. Canadian investors also have access to broader U.S. market solutions.
One example is the BMO MSCI USA Equal Weight Index ETF – ZEQL. This ETF tracks an index that includes the same companies as the MSCI USA Index, but weights them equally rather than by market capitalization. At each quarterly rebalance, every stock is reset to the same allocation. The practical effect, generally speaking, results in higher yield and lower valuations.
Chart 3: MSCI USA Equal Weighted Index (USD) Index Performance and Fundamentals
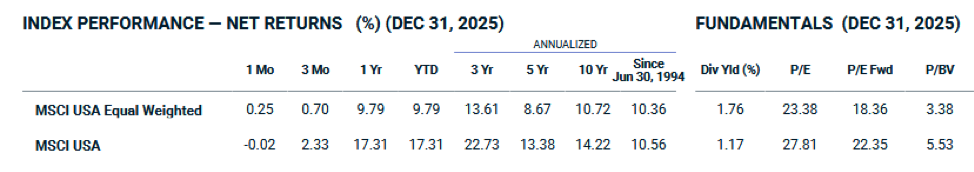
Source: MSCI as of December 31, 2025 7 Index returns do not reflect transactions costs or the deduction of other fees and expenses and it is not possible to invest directly in an Index. Past performance is not indicative of future results.
Continue Reading…