

By Hamilton ETFs
(Sponsor Blog)
Investing in companies that sustain and/or increase their dividends through different economic cycles is widely regarded as a prudent investing strategy, as sustainable dividend policies typically serve as a proxy for identifying high-quality businesses.
Companies with a track record of dividend growth often exhibit strong, reliable cash flows, disciplined capital allocation, and a clear commitment to returning value to shareholders. Such an investing approach can provide a steadily rising income stream to help offset inflation and enhance total returns over time.
We are excited to unveil the HAMILTON CHAMPIONS™ ETFs: built for long-term growth from exposure to blue-chip Canadian and U.S. companies with consistent track records of growing dividends (CMVP/SMVP). The suite also includes two Enhanced HAMILTON CHAMPIONS™ ETFs that utilize modest 25% leverage to further enhance long-term growth potential (CWIN/SWIN).
The Lineup
| Ticker | Name | |
| CMVP | HAMILTON CHAMPIONS™ Canadian Dividend Index ETF | 0% management fee through Jan. 31, 2026[6] |
| SMVP | HAMILTON CHAMPIONS™ U.S. Dividend Index ETF | 0% management fee through Jan. 31, 2026[6] |
| CWIN | HAMILTON CHAMPIONS™ Enhanced Canadian Dividend ETF | CMVP + modest 25% leverage |
| SWIN | HAMILTON CHAMPIONS™ Enhanced U.S. Dividend ETF | SMVP + modest 25% leverage |
Strong Performance, Low Volatility
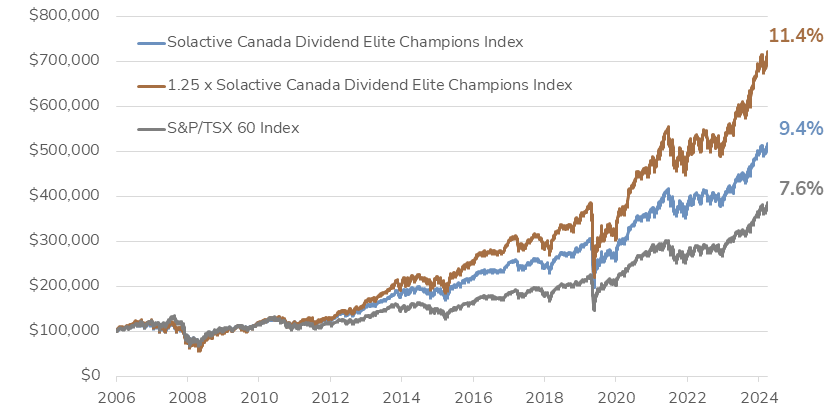
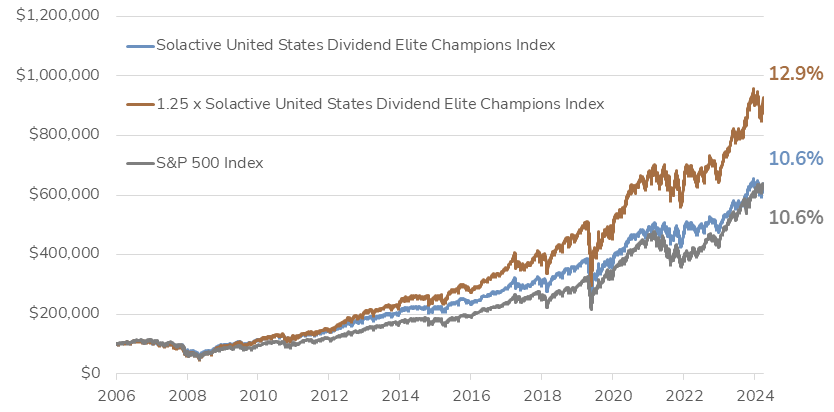
The HAMILTON CHAMPIONS™ ETFs are designed to track the Solactive Dividend Elite Champions Indices[7]. Boththe Canadian and U.S. indices have demonstrated strong performance and low volatility historically relative to the S&P/TSX 60 and the S&P 500, respectively.
Canadian HAMILTON CHAMPIONS™ — Growth of $100K [8],9]
U.S. HAMILTON CHAMPIONS™ — Growth of $100K [8, 10]
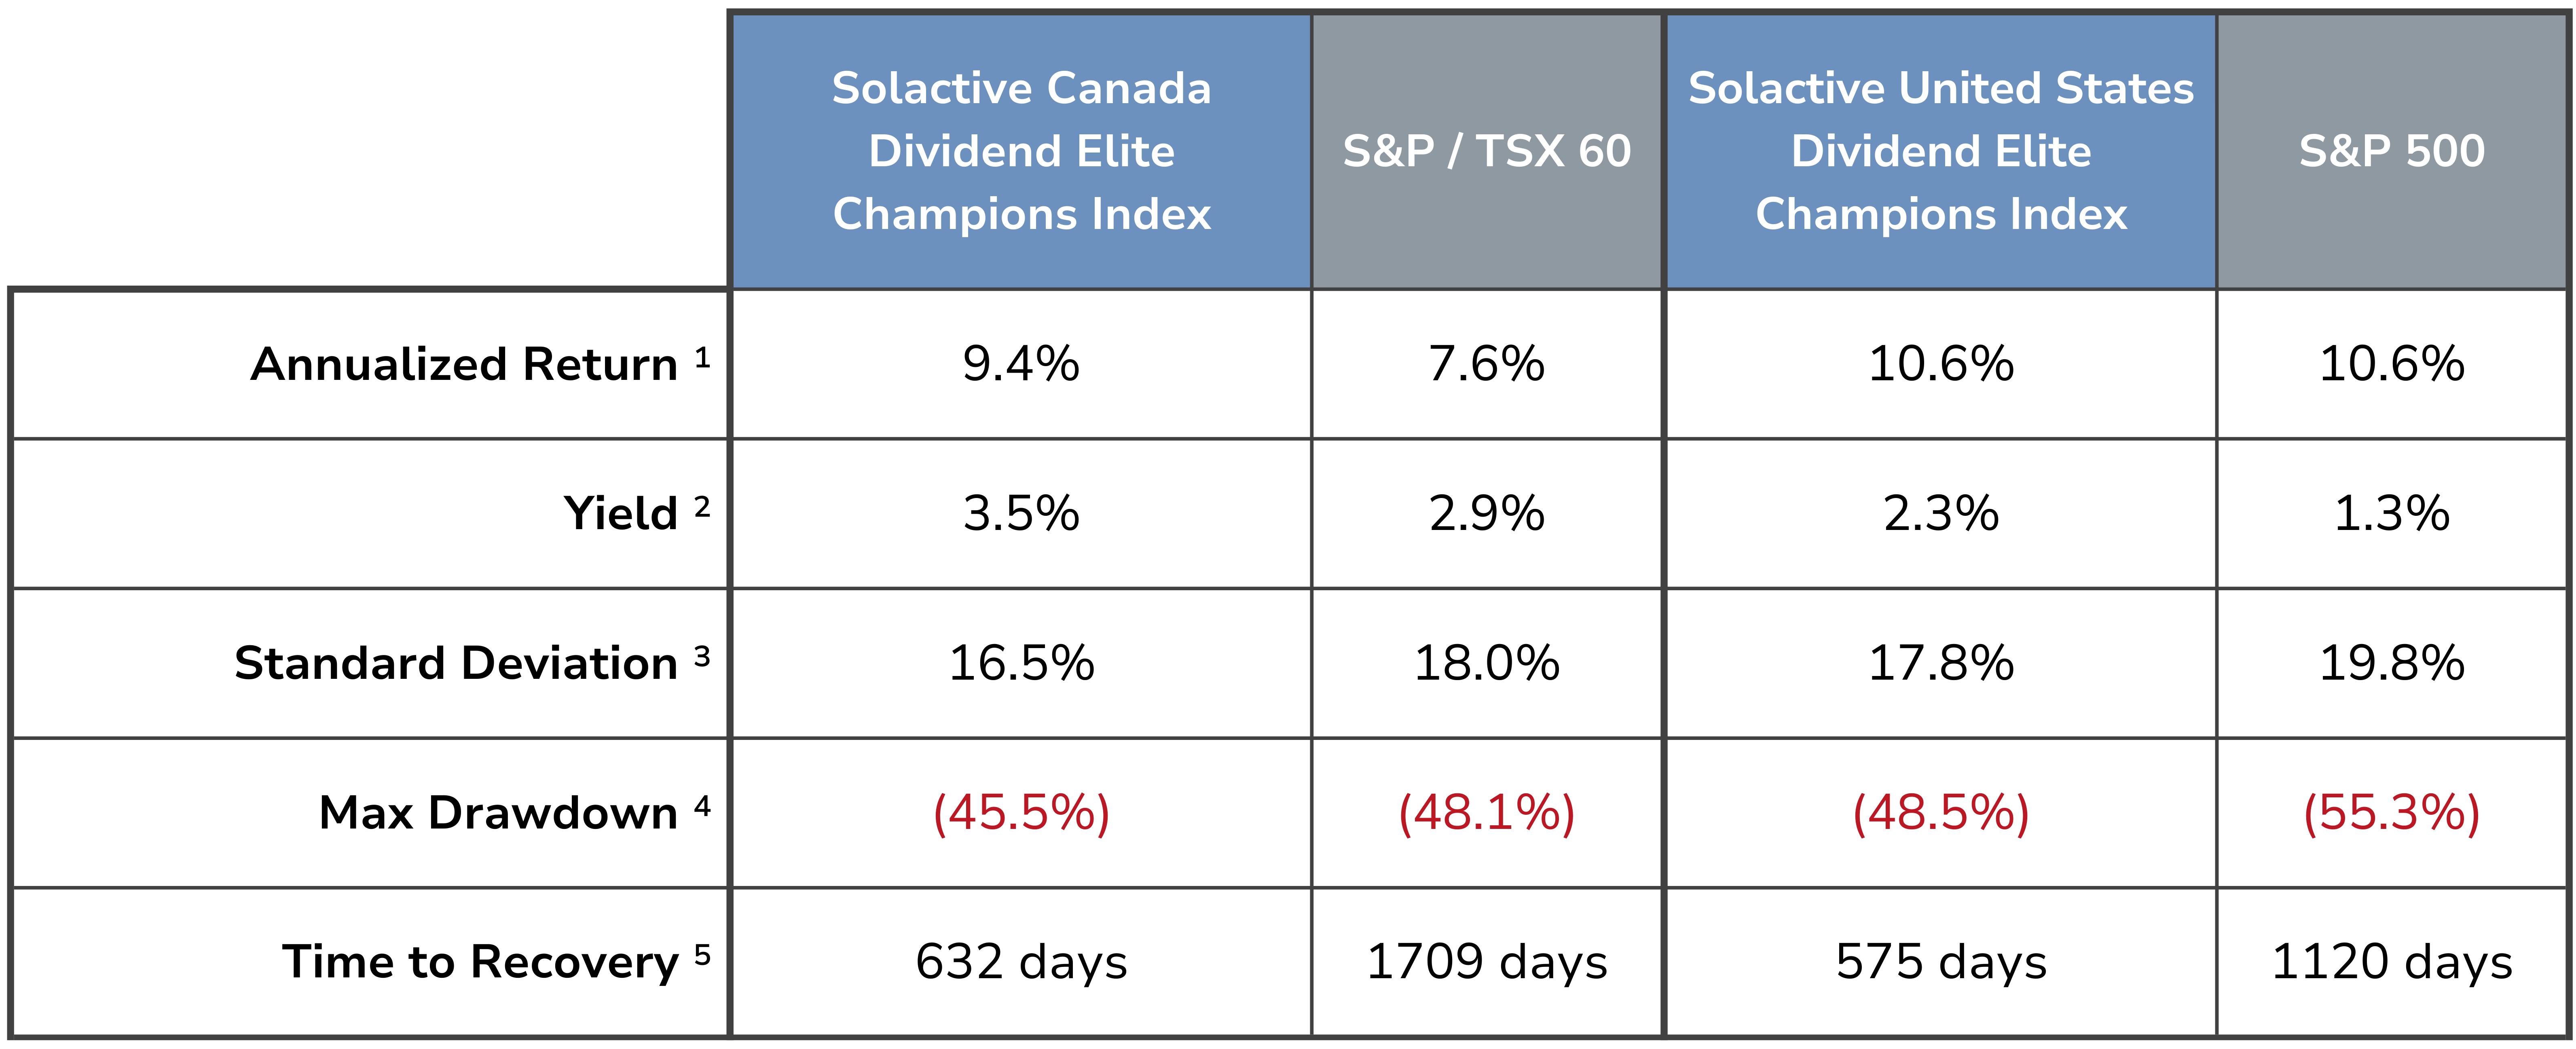
The Canada Dividend Champions Index and U.S. Dividend Champions Index are designed to provide equal-weight exposure to blue-chip stocks, listed in their respective countries, with a long history of dividend growth/sustainability. The result is a Canadian and a U.S. index with favourable performance and risk profiles vs. the S&P/TSX 60 and S&P 500, respectively. In addition, both indices have demonstrated (i) lower relative volatility; (ii) lower relative drawdowns; and (iii) faster relative time to recovery.
DISCLAIMER: see footnotes 1-5 below
Proven Winners, Rising Dividends
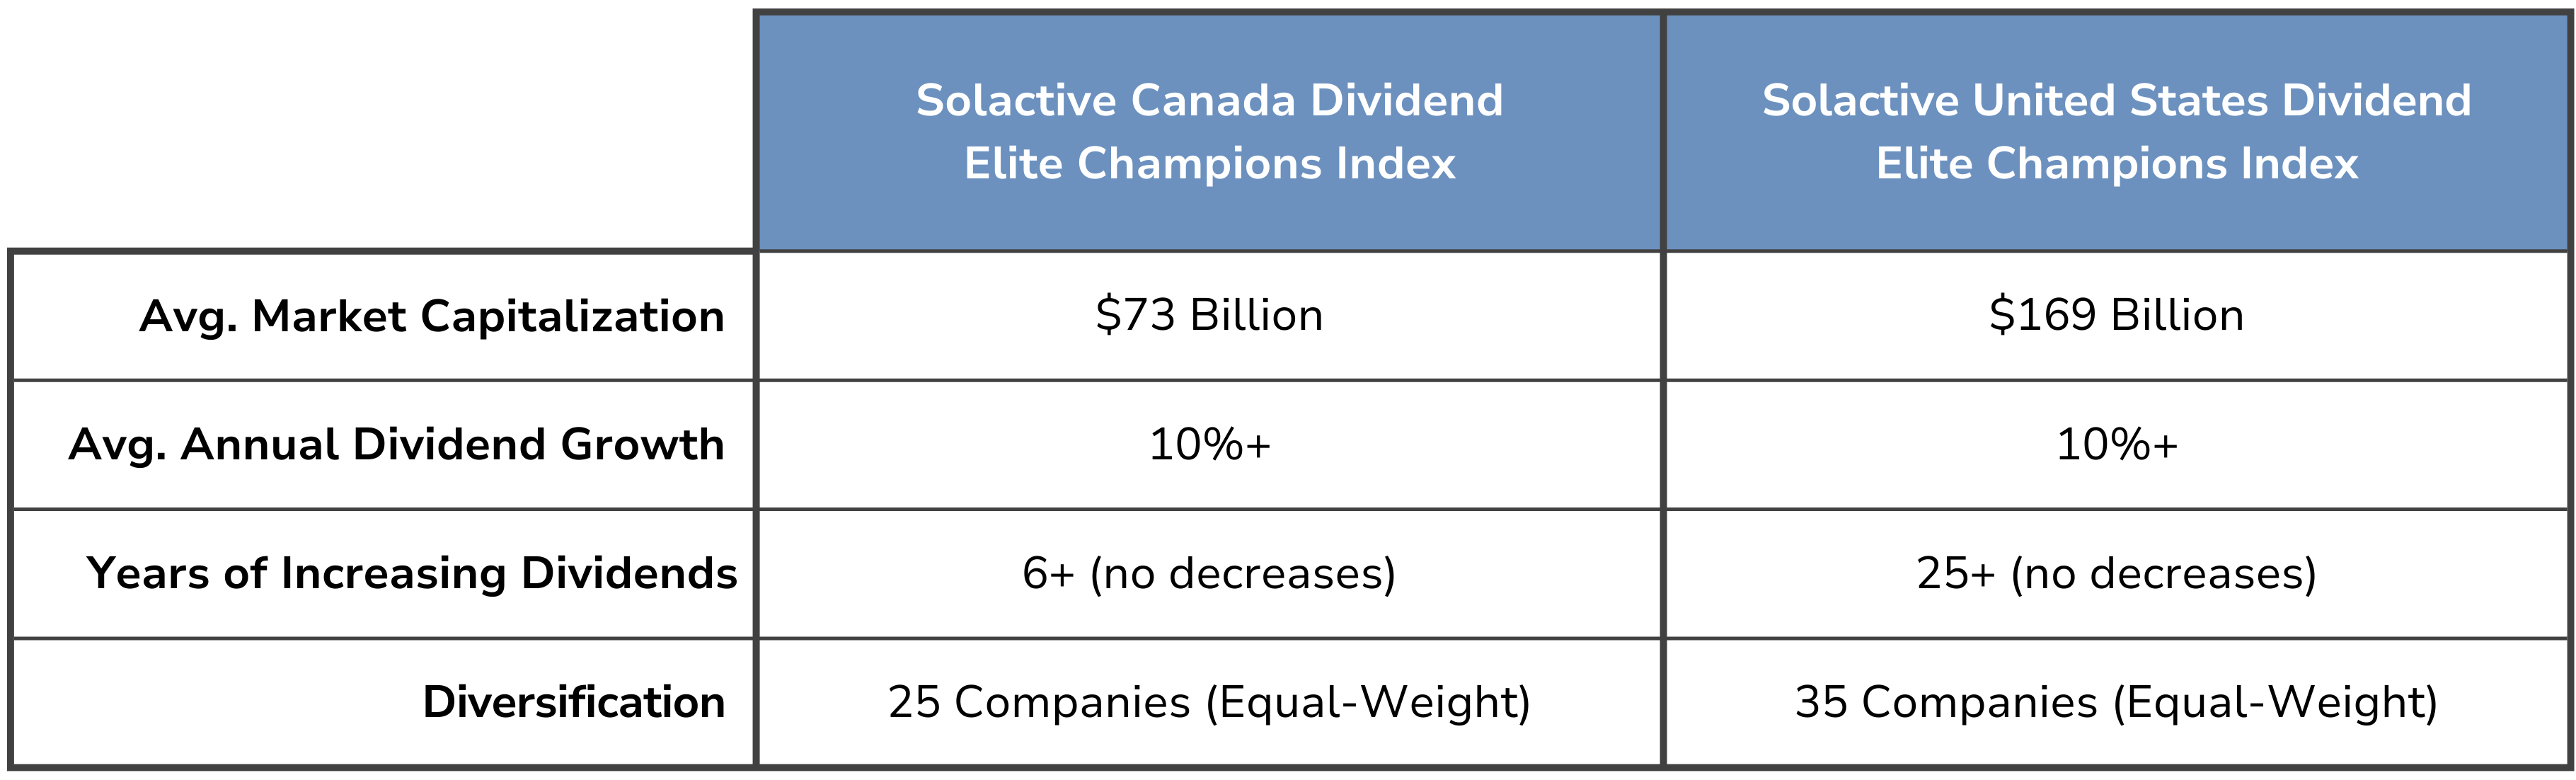
The Solactive Dividend Elite Champions Indices are focused on delivering diversified portfolios of companies with a long history of increasing dividends. The resulting portfolios have the following important characteristics:
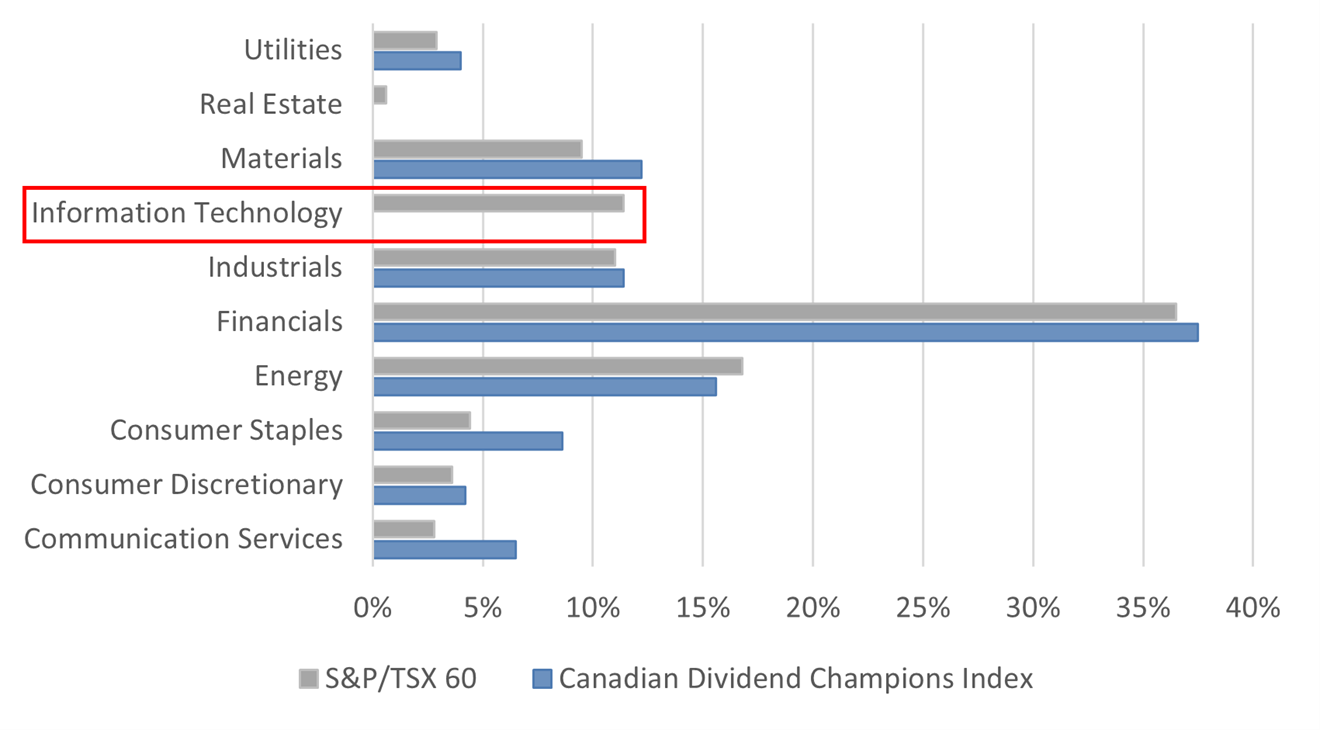
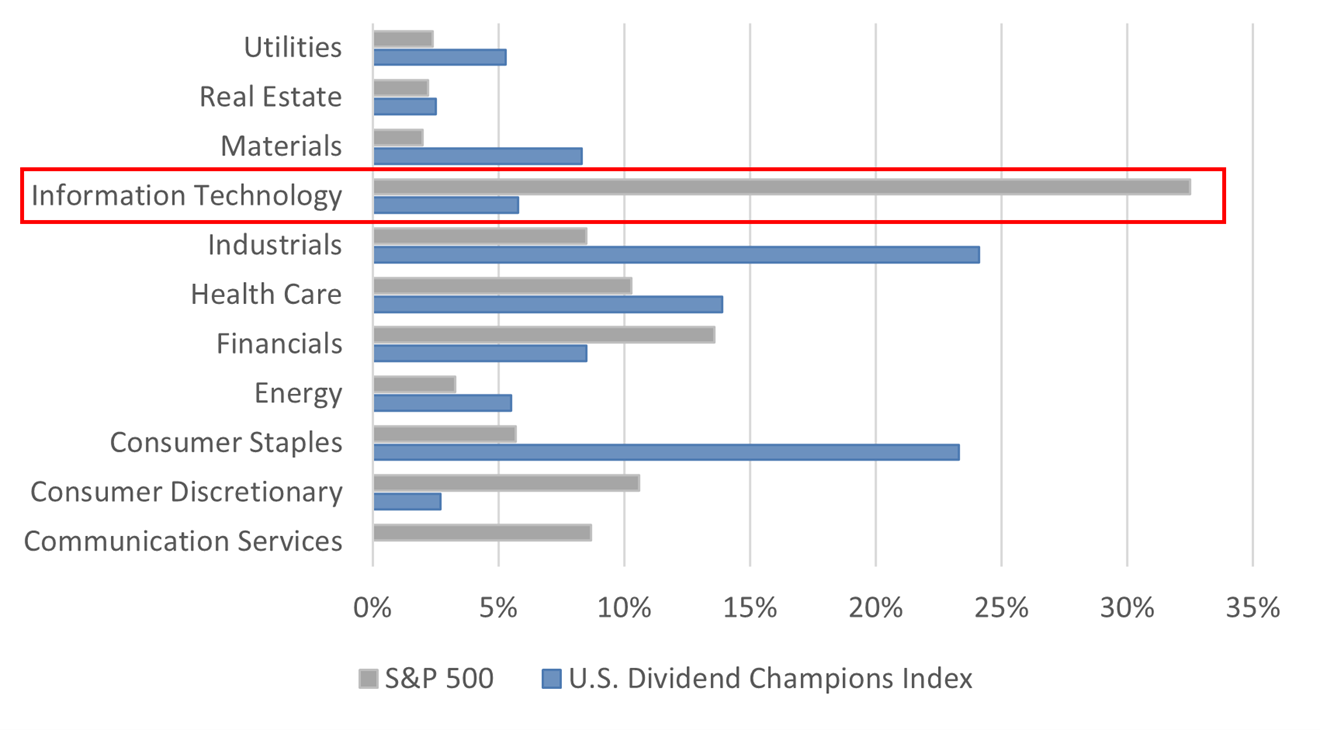
Less Tech, Less Risk
The Solactive Dividend Elite Champions Indices offer a unique sector composition with a notably smaller weighting in technology compared to the S&P 500, where tech accounts for over 30%. Technology stocks often trade at higher valuations due to growth expectations, which can increase risk. By focusing on companies that prioritize dividend payments, these indices provide investors with broad equity exposure while reducing their concentration in the high-valuation tech sector.
Sector Mix — Canada[11]
Sector Mix — U.S.[11]
Dividend Growers, Built to Win
The HAMILTON CHAMPIONS™ ETFs offer investors a disciplined approach to dividend growth investing, focusing on blue-chip companies with proven long-term track records of increasing/sustaining dividends across economic cycles. Designed to provide long-term growth and consistent monthly income, these ETFs offer a compelling solution for investors prioritizing quality and consistency.
____
A word on trading liquidity for ETFs …
 Hamilton ETFs are highly liquid ETFs that can be purchased and sold easily. ETFs are as liquid as their underlying holdings and the underlying holdings trade millions of shares each day.
How does that work? When ETF investors are buying (or selling) in the market, they may transact with another ETF investor or a market maker for the ETF. At all times, even if daily volume appears low, there is a market maker – typically a large bank-owned investment dealer – willing to fill the other side of the ETF order (at net asset value plus a spread). The market maker then subscribes to create or redeem units in the ETF from the ETF manager (e.g., Hamilton ETFs), who purchases or sells the underlying holdings for the ETF.
____
Commissions, management fees and expenses all may be associated with investments in exchange traded funds (ETFs) managed by Hamilton ETFs. Please read the prospectus before investing. Indicated rates of return are the historical annual compounded total returns including changes in per unit value and reinvestment of all dividends or distributions and does not take into account sales, redemptions, distribution or optional charges or income taxes payable by any securityholder that would have reduced returns. Only the returns for periods of one year or greater are annualized returns. ETFs are not guaranteed, their values change frequently and past performance may not be repeated.

Certain statements contained in this website may constitute forward-looking information within the meaning of Canadian securities laws. Forward-looking information may relate to a future outlook and anticipated distributions, events or results and may include statements regarding future financial performance. In some cases, forward-looking information can be identified by terms such as “may”, “will”, “should”, “expect”, “anticipate”, “believe”, “intend” or other similar expressions concerning matters that are not historical facts. Actual results may vary from such forward-looking information. Hamilton ETFs undertakes no obligation to update publicly or otherwise revise any forward-looking statement whether as a result of new information, future events or other such factors which affect this information, except as required by law.

____
Source: Bloomberg, Solactive AG, Hamilton ETFs. Data from November 1, 2006, to January 31, 2025.
- Annualized Return: The annualized total rate of return.
- Yield: The annual dividend income expressed as a percentage of the share price on January 31, 2025.
- Standard Deviation: A measure of an investment’s return volatility, indicating the degree of variation from its average return.
- Max Drawdown: The largest percentage drop from an investment’s peak value to its lowest point.
- Time to Recovery: The time it takes for an investment to recover from its max drawdown and reach its previous peak value; Past performance is not indicative of future results. Investors cannot directly invest in the index. All performance data assumes reinvestment of distributions and excludes management fees, transaction costs, and other expenses which would have impacted an investor’s results. Solactive Canada Dividend Elite Champions Index and Solactive United States Dividend Elite Champions Index data prior to December 31, 2024, is hypothetical back-tested data using actual historical market data. Actual performance may have been different had the index been live during that period.
- Annual management fee of 0.19% is rebated to an effective management fee of 0.00% until at least January 31, 2026.
- The Solactive Dividend Elite Champions Indices are together the Solactive Canada Dividend Elite Champions Index (“Canadian Dividend Champions Index”) and Solactive United Stated Dividend Elite Champions Index (“U.S. Dividend Champions Index”).
- Source: Bloomberg, Solactive AG, Hamilton ETFs. Data from November 1, 2006, to January 31, 2025. The graphs are for illustrative purposes only and intended to demonstrate the historical impact of compounding returns and the use of 1.25x leverage. It is not a projection of future index performance, nor does it reflect potential returns on investments in the ETFs. Investors cannot directly invest in an index. All performance data assumes reinvestment of distributions and excludes management fees, transaction costs, borrowing costs, and other expenses which would have impacted an investor’s returns. Solactive Canada Dividend Elite Champions Index (SDLCACT) and Solactive United States Dividend Elite Champions Index (SDLUSCT) data prior to December 31, 2024, is hypothetical back-tested data using actual historical market data. Actual performance may have been different had the indices been live during that period.
- SDLCACT vs. the S&P/TSX 60 Total Return Index with annual compounded total returns and the potential impact of 1.25x leveraged exposure to SDLCACT.
- SDLUSCT vs. the S&P 500 Index with annual compounded total returns and the potential impact of 1.25x leveraged exposure to SDLUSCT.
- Source: Bloomberg, Hamilton ETFs.
