Tag Archives: asset allocation

How often should you rebalance your portfolio?

By Dale Roberts, cutthecrapinvesting

Special to Financial Independence Hub

How often should you rebalance your portfolio? There’s good news on that front as less is more. We’ll take a look at a very telling chart from Frederick Vettese. And I take another look at the very telling perfomance table for the core Tangerine Portfolios. In this post I will also take you through my top observations of the week – by way of my Twitter / X Tweets. That includes – bonds vs GICs, big dividends under attack, my U.S stock portfolio returns, and what’s in store for the Canadian banks.

Courtesy of Fred Vettese in the Globe and Mail, a look at rebalancing a core ETF portfolio.

Here’s the link for those who have a Globe subscription.

On April 1, 2013, $1,000 was invested in each of four exchange-traded funds: a U.S. stock ETF, denominated in Canadian dollars (stock symbol XUS), a Canadian stock ETF (XIC), an international stock ETF (XEF) and a Canadian bond ETF (XBB). The initial asset mix is therefore 75-per-cent equities and 25-per-cent bonds.

Fred’s test showed almost identical results for rebalancing every quarter and once a year. That suggests that you can save yourself some time and effort (and perhaps trading costs) by rebalancing just once a year.

We can also see that when the unbalanced portfolio performed better during a period of robust stock returns. That said, the portfolio risk level has increased.

I have been evaluating portfolios for many years (decades) and more often find that rebalancing once a year often leads to greater returns. It allows a successful asset to go on a greater run before the money is moved to the under performing asset.

You might also consider rebalancing based on thresholds – perhaps when an asset is 5% or more about your target allocation.

The lessons of the Tangerine Portfolios

I had another look at the index-based Tangerine Portfolios. As you may know I was an advisor and trainer with Tangerine for several years. Those are a wonderful solution for those who want lower-fee managed portfolios and investment advice.

You can also have a look at the Tangerine Global ETF Portfolios.

There are many lessons that can be learned or observed from the returns of the portfolio models. I offered some ideas in this Twitter thread.

While you can check out that thread, and yes you should follow me on Twitter / X I will strip out the main lessons (shown below).

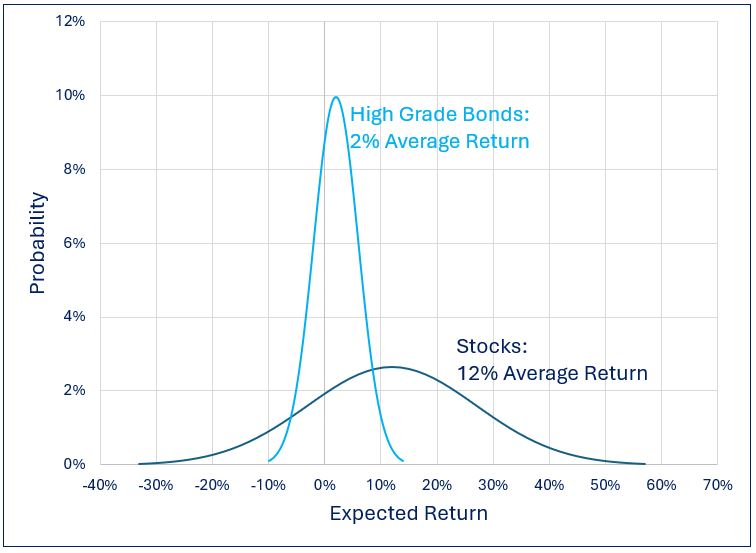
Lesson 1: Risk and returns

Investors were rewarded for taking on more risk. The risk/reward proposition.

An all-equity portfolio might earn in the area of 9% annual, while a balanced growth model is more 7%’ish and a balanced model more 6%’ish. Keep in mind that the start dates for the balanced portfolios was terrible – just before the financial crisis in 2008. Continue Reading…

Playing Defense with Sector ETFs

Here’s how an equally weighted portfolio of healthcare, utility, and consumer staples ETFs could provide better downside protection and reduce volatility.

Image courtesy BMO ETFs/Getty Images

By Erin Allen, Director, Online Distribution, BMO ETFs

(Sponsor Blog)

The U.S. stock market, particularly the S&P 500 index, isn’t as uniform as it might seem. While you may think of it as a homogenous entity, it’s far from reality.

The S&P 500 can be broken down into 11 Global Industry Classification System (GICS) sectors: information technology, health care, financials, consumer discretionary, communication services, industrials, consumer staples, energy, utilities, real estate, and materials.

Each sector groups together companies that operate in the same industry and offer similar products and services. Historically, different sectors have also shown varying levels of sensitivity to market and economic conditions.

Some are cyclical, meaning they typically do well during economic expansions but struggle in downturns. On the other hand, some sectors are considered defensive, as their revenues and earnings remain stable regardless of economic cycles.

One well-known investment strategy that takes advantage of these differences is sector rotation, where investors shift their money between sectors based on macroeconomic indicators like GDP growth, interest rates, and inflation.

Source: SPDR Americas Research. ++/– indicates the best/worst two performing sectors. +/- indicates the third best/worst performing sectors. The Energy sector did not make the top/bottom three sectors during any cycles, as it is less sensitive to U.S. economic cycles but more driven by global supply and demand of crude oil. For illustrative purposes only. 1

However, for risk-conscious investors, another approach involves overweighting defensive sectors — particularly health care, utilities, and consumer staples — to provide better downside protection and reduce portfolio volatility.

What makes a sector defensive?

A sector is considered defensive when its companies provide goods or services that consumers continue to purchase regardless of economic conditions.2

For example, when the economy weakens, a consumer might delay buying a new car or upgrading their phone. These are discretionary purchases: non-essential items that can be postponed until financial conditions improve.

In contrast, even during a recession, people still pay their water and gas bills and continue buying household essentials like groceries and personal care products.

The underlying economic principle at play here is elasticity. In economics, elasticity measures how much the quantity demanded of a product changes in response to price or income changes.

Goods with inelastic demand see little fluctuation in consumption, even when prices rise or consumer income declines. This makes sectors with inelastic demand more stable during market downturns.

  • Utilities: Electricity, water, and gas are necessities that households and businesses must pay for, regardless of economic conditions.
  • Consumer Staples: Essential items like food, personal care products, and household goods remain in demand even when discretionary spending drops.
  • Health Care: Medical services, prescription drugs, and insurance are critical expenses that people prioritize, often regardless of cost.

How defensive are these sectors?

One way to quantify how defensive a sector has historically been is to look at its beta, a measure of volatility relative to the broader market3.

The market itself has a beta of 1.0, meaning any stock or sector with a beta below 1.0 tends to be less volatile and moves less than the overall market during upswings and downturns.

When analyzing long-running sector ETFs, the historical five-year betas confirm that health care, consumer staples, and utilities have lower volatility than the broader market.

The Health Care Select Sector SPDR Fund (XLV) has a beta of 0.644, The Consumer Staples Select Sector SPDR Fund (XLP) comes in even lower at 0.575, and The Utilities Select Sector SPDR Fund (XLU) has a beta of 0.746. This suggests that all three sectors historically experience smaller price swings compared to the S&P 500.

Further supporting this, research from State Street Global Advisors examined periods of steep market drawdowns. Between 1999 and 2022, there were 11 instances where the S&P 500 declined by 10% or more in a single quarter7.

They found that an equally weighted portfolio of health care, consumer staples, and utilities delivered significantly smaller losses than both the S&P 500 and the Russell 1000 Value Index.

 Morningstar direct. Data as of 6/30/227

This demonstrates how overweighting defensive sectors has historically provided better downside protection in times of market stress versus broad market indices.

The ETFs for the job

BMO’s lineup of SPDR Select Sector Index ETFs includes three options that align with the defensive sectors discussed earlier. These ETFs provide targeted exposure to U.S. health care, consumer staples, and utilities, ensuring investors can overweight these segments without exposure to the rest of the S&P 500. Continue Reading…

All-in-one ETF showdown TD vs. BMO vs. iShares vs. Vanguard: Which is best?

Image courtesy Tawcan/Unsplash

By Bob Lai, Tawcan

Special to Financial Independence Hub

Over the years, I have come to really like the all-in-one ETFs from Vanguard and iShares. I like these ETFs because they are a simple way to diversify your portfolio across different sectors and countries. These ETFs also automatically rebalance regularly, making an investor’s life much easier.

Due to the popularity of the all-in-one ETFs, both TD and BMO also created similar ETFs. Which company offers the best all-in-one ETFs? Are TD ETFs better? Are iShares ETFs better? Are Vanguard ETFs better? Or are BMO ETFs better?

Let’s find out!

TD ETFs

TD has many different ETFs, including active ETFs, special focused ETFs, and broad market index ETFs that are well-suited for different investment strategies. When it comes to all-in-one ETFs, TD offers three different ETFs that were created in 2020:

All three of these TD all-in-one ETFs have a MER of 0.17%. This means if you have $1k invested in one of these ETFs, you effectively would pay $1.7 in fees every year, which is extremely cheap if you think about it.

Here are the historical performances of these three ETFs:

1 Yr 2 Yr 3 Yr
TCON 12.48% 9.63% 4.41%
TBAL 19.27% 14.96% 8.04%
TGRO 26.27% 20.16% 11.70%

You can buy and sell all three ETFs via online brokers. Since many brokers offer commission-free trades nowadays, you can buy one of these all-in-ones regularly and build up your portfolio.

BMO ETFs

Like TD, BMO offers five different all-in-one ETFs (BMO calls them Asset Allocated ETFs).

All five BMO all-in-ones have an MER of 0.20%.

ZBAL and ZESG are very similar, except ZESG is for investors looking to align their investments with their social values.

Here are the historical performances of the five BMO ETFs:

1 Yr 2 Yr 3 Yr
ZCON 13.94% 9.74% 4.79%
ZBAL 18.67% 13.10% 7.25%
ZESG 18.63% 14.61% 7.68%
ZGRO 23.52% 16.49% 9.71%
ZEQT 28.35% 19.83% 12.09%

ZCON, ZBAL, and ZESG have more than 40% exposure to Canada, while ZGRO and ZEQT are more heavily exposed to the US.

iShares ETFs

Like BMO, iShares offers five all-in-one ETFs. 

All five ETFs have an MER of 0.20%.

Here are the historical performances of the five iShares ETFs:

1 Yr 3 Yr
XINC 9.97% 2.81%
XCNS 14.38% 5.07%
XBAL 18.81% 7.70%
XGRO 23.47% 9.65%
XEQT 28.06% 11.92%

Vanguard ETFs

Finally, Vanguard all-in-one ETFs:

VRIF has an MER of 0.29%, while the other five all-in-ones have an MER of 0.22%. VRIF probably has a slightly higher MER because of the fund structure. Interestingly enough, Vanguard all-in-ones have the highest MER out of the four fund companies (I said this because historically Vanguard has lead the way when it comes to lowest MER).

Here are the historical performances of the Vanguard all-in-one ETFs:

1 Yr 3 Yr
VCIP 8.90% 1.99%
VRIF 10.44% 3.08%
VCNS 13.61% 4.45%
VBAL 18.40% 6.90%
VGRO 23.39% 9.39%
VEQT 28.40% 11.83%

The best all-in-one ETFs for your investment portfolio

As you can see, all four fund companies offer all-in-one ETFs with different asset exposures. Which are the best all-in-one ETFs for your investment portfolio?

Well, that is totally dependent on your risk tolerance and your investment timeline.

If you are an investor who is approaching retirement or is already retired, you might want to invest in something more conservative. In other words, you don’t want to lose sleep whenever there’s a market correction. For you, a steady investment income and stable portfolio value growth is more important. Therefore, you probably will go with either a conservative all-in-one ETF or a balanced all-in-one ETF.

If you are younger with a longer investment time horizon, you want to aim for portfolio growth. Therefore, you’d probably go with either a growth all-in-one ETF or an all-equity ETF to maximize your return over the long term.

Best Conservative All-in-One ETF

As mentioned, if you are a conservative investor who needs a steady investment income with stable portfolio value growth, a conservative all-in-one ETF is probably the best choice for you.

The question is, which conservative all-in-one ETF is the best?

Let’s compare TCON, ZCON, XINC, XCON, VCIP, VRIF, and VCONs all of which are heavily exposed to fixed income.

Fixed income to equities Mix MER  1 yr return 3 yr return 5 yr return Yield %
TCON 70-30 0.17% 12.48% 4.41% N/A 2.26%
ZCON 60-40 0.20% 13.94% 4.79% 4.87% 2.45%
XINC 80-20 0.20% 9.97% 2.81% 2.86% 2.70%
XCON 60-40 0.20% 14.38% 5.07% 5.35% 2.17%
VCIP 80-20 0.25% 8.90% 1.99% 2.11% 2.86%
VRIF 70-30 0.32% 10.44% 3.08% N/A 3.55%
VCON 60-40 0.24% 13.61% 4.45% 4.71% 2.51%

Among ZCON, XCON, and VCON, which all have the same 60-40 mix, it’s interesting to see that XCON had the best returns consistently, but XCON has the lowest distribution yield.

Among TCON, XINC, VCIP, and VRIF, TCON has had the highest returns, most likely due to the lower MER fees.

Not surprisingly, ETFs with a higher exposure to stocks have had higher returns in the last five years. Continue Reading…

Offence vs Defence

  • Ch-ch-ch-ch-changes
  • Turn and face the strange
  • Ch-ch-changes
  • Don’t want to be a richer man
  • Ch-ch-ch-ch-changes
  • Turn and face the strange
  • Ch-ch-changes
  • There’s gonna have to be a different man
  • Time may change me
  • But I can’t trace time — Changes, by David Bowie
Image courtesy Outcome/Shutterstock

By Noah Solomon

Special to Financial Independence Hub

There is a basic principle that most people follow when it comes to their spending decisions. In essence, people generally try to either

(1) Get the most they can for the least amount of money, or

(2) Spend the least amount of money on the things they want (i.e. get the best deal)

In other words, rational utility maximizers try to be as efficient as possible when parting with their hard-earned dollars.

Strangely, many investors abandon this principle when it comes to their portfolios. With investing, what you get is return (hopefully more than less), and what you pay (other than fees) is risk. People often focus on return without any regard for the amount of risk they are taking. Alternately, many make the mistake of reducing risk at any cost, regardless of the magnitude of potential returns they leave on the table.

The foundation of successful investing necessitates achieving an optimal balance between return and risk. Different types of assets (volatile speculative stocks, stable dividend paying stocks, bonds, etc.) have very different risk and return characteristics. Relatedly, a portfolio’s level of exposure to different asset classes is the primary determinant of its risk and return profile, including how efficient the balance is between the two.

Offense, Defense, & Bobby Knight

Robert Montgomery “Bobby” Knight was an American men’s college basketball coach. Nicknamed “the General,”h e won 902 NCAA Division I men’s basketball games, a record at the time of his retirement. He is quoted as saying:

“As coaches we talk about two things: offense and defense. There is a third phase we neglect, which is more important. It’s conversion from offense to defense and defense to offense.”

Nobody can escape the fact that you can’t have your cake and eat it too. You can’t increase potential returns without taking greater risk. Similarly, you can’t reduce the possibility of losses without reducing the potential for returns.

Picking up Pennies in Front of a Steamroller vs. Shooting Fish in a Barrel

Notwithstanding this unfortunate tradeoff, there are times when investors should focus heavily on return on capital (i.e. being more aggressive), times when they should be more concerned with return of capital (i.e. being more defensive), and all points in between.

Sometimes, there is significantly more downside than upside from taking risk. Although it is still possible to reap decent returns in such environments, the odds aren’t in your favour. Reaching further out on the risk curve in such regimes is akin to picking up pennies in front of a steamroller:  the potential rewards are small relative to the possible consequences. At the other end of the spectrum, there are environments in which the probability of gains dwarfs the probability of losses. Although there is a relatively small chance that you could lose money in such circumstances, the wind is clearly at your back. At these junctures, dialing up your risk exposure is akin to shooting fish in a barrel – the likelihood of success is high while the risk of an adverse event is small.

John F. Kennedy & the Chameleonic Nature of Markets

Former President John F. Kennedy asserted that “The one unchangeable certainty is that nothing is certain or unchangeable.” With regard to markets, the risk and return profiles of different asset classes are not stagnant. Rather, they change over time depending on a variety of factors, including interest rates, economic growth, inflation, valuations, etc.

Given this dynamic, it follows that determining your optimal asset mix is not a “one and done” treatise, but rather a dynamic process that takes into account changing conditions. Yesterday’s optimal portfolio may not look like today’s, which in turn may be significantly different than the one of the future.

It’s not just the risk vs. return profile of any given asset class that should inform its weight with portfolios, but also how it compares with those for other asset classes. As such, investors should use changing risk/return profiles among asset classes to “tilt” their portfolios, increasing the weights of certain types of investments while decreasing others.

In “normal” times, the expected return from stocks exceeds the yields offered by cash and high-grade bonds by roughly 3% per annum. However, this difference can expand or contract depending on economic conditions and relative valuations among asset classes.

In the decade plus era following the global financial crisis, not only did rates remain at historically low levels, but the prospective returns on equities were abnormally high given the positive impact that low rates have on spending, earnings growth, and multiples. Against this backdrop, the prospective returns from stocks far exceeded yields on safe harbour investments. Under these conditions, it is no surprise that investors who had outsized exposure to stocks vs. bonds were handsomely rewarded.

Expected Return on Stocks vs. Yield on High Grade Bonds: Post GFC Era

As things currently stand, the picture is markedly different. Following the most significant rate-hiking cycle in decades, bonds are once again “back in the game.” Moreover, lofty equity market valuations (at least in the U.S.) suggest that the S&P 500 Index will deliver below-average returns over the next several years. Continue Reading…

Canada’s best Asset Allocation ETFs


By Dale Roberts

Special to Financial Independence Hub

When the Canadian asset allocation ETFs were introduced several years ago, the investment community hailed them as “game changers.” That is, the final nail in the coffin for high-fee / low-performance Canadian mutual funds.

The asset allocation ETFs are well-diversifed, managed global portfolios available at 5 risk levels. The fees represent about a 90%-off sale compared to the typical mutual fund. The fees range from 0.17% to 0.25%. It’s a no-brainer for most Canadians. You can open an account with a discount brokerage, enter one ticker symbol (XEQT for example), enter an amount, press Buy and own thousands of companies around the globe. Are these the best funds available in Canada? Yes, that’s a rhetorical question.

Here’s an ode to XEQT from Loonies and Sense.


Cut The Crap Investing is the only blog that tracks the performance of the leading Asset Allocation ETF providers. I also sort them by risk level. For example, you’ll see the performance comparison between the balanced portfolios from Vanguard and BlackRock and the rest of the AA gang. You’ll also see the surprising outlier “winner” that includes modest amounts of bitcoin in its offerings.

Check out the ultimate Canadian asset allocation ETF page. Here’s a teaser: the balanced growth models. They range from 80% stocks / 20% bonds to 90% stocks / 10% bonds. The returns listed are average annual.

Build your own portfolio

While the asset allocation ETFs are the easiest, hands-off way to go, you can certainly build your own ETF portfolio. You’ll save modestly on fees, and you will be allowed some flexibility on how you would like to shape the portfolio. I’ve offered examples of core portfolio models.

Here’s the updated (to the end of 2024) total returns for the core Canadian ETF Portfolios on Cut The Crap Investing. The build-your-own models have outperformed the asset allocation ETFs, in modest fashion. Continue Reading…