By John De Goey, CFP, CIM
Special to the Financial Independence Hub
Like most Canadians, financial advisors exist all over the income spectrum. The major difference is that a disproportionate number of them are highly successful. That should come as no surprise. Many would-be clients are comforted by this and some even seek out advisors who are conspicuously successful because obvious opulence is a double form of social proof. First, it implies that advisor is good at what he does by using the rough correlation that financial success and financial savvy correlate highly. Second, it implies that the client has “made it” by being able to afford the services of someone so obviously brilliant.
In 2020, the top tax bracket [in Canada] kicks in at $214,368, which is just below the threshold for being a one percenter. It’s only natural that smart, forward-looking professional advisors should attract the smartest and most forward-looking clients. One percenters. Similarly, it’s only natural that the most desirable would-be clients should seek out the best advisors.
In some endeavours, merit and talent are difficult to discern. For instance, doctors are paid through public health programs. That likely makes it harder to tell which are good and which are not. Other fields, such as law and accounting, allow for a more conspicuous assessment based on the social norms of affluence. Basically, the superior professionals can signal their desirability through how they dress, the car they drive, the watch they wear and (if it comes to that) the neighbourhood they live in. For better or worse, many would-be clients look to these social cues as evidence of competence and excellence.
Jury is out on whether advisors should be like the client
This exercise could have implications for the provision of financial advice. Many people recommend that, when looking for an advisor, one should actively seek out someone who is more or less like themselves. In terms of demographics, geography, values and the like, the theory goes that there’s simply a better chance of getting a good fit if you look for an advisor who is like you. I don’t know how statistically robust the theory is, but it makes sense intuitively. Of course, online dating sites make similar recommendations and offer similar results. The jury is out.
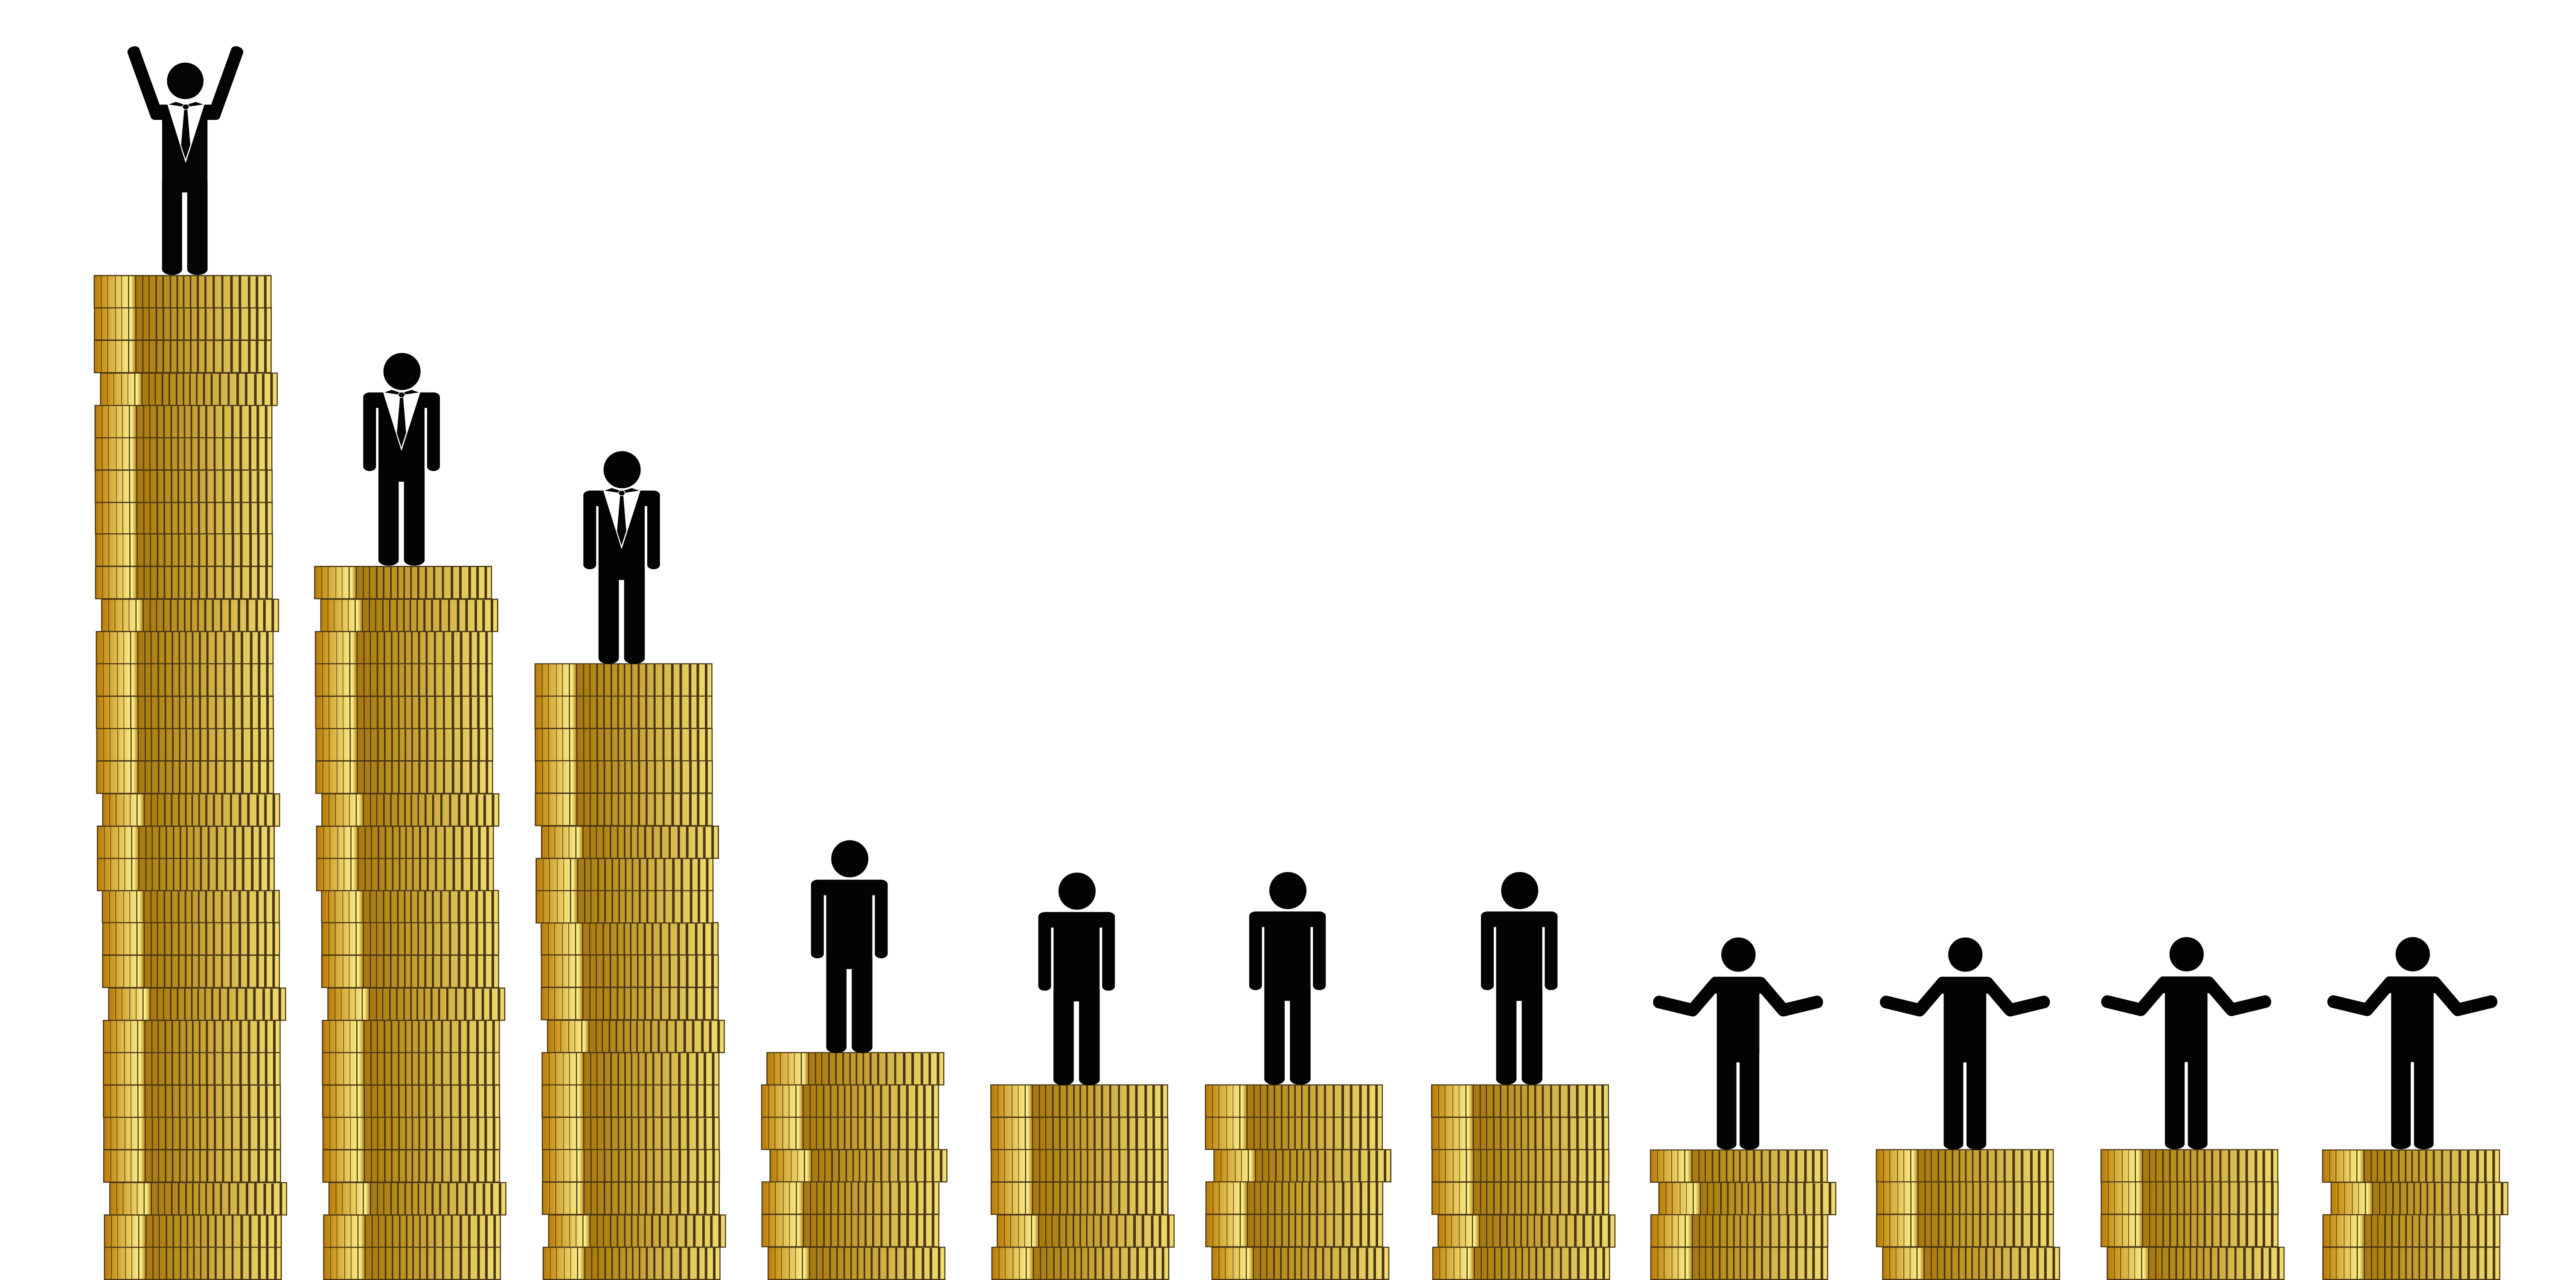
If you were to divide Canadians into five equal groups, with each representing a 20% portion of income earners, the top quintile (80% to 100%) would be earning more than the national average (on average), the second quintile (60% to 80% would be earning about the same as the national average (on average) and the three lowest groups (0% to 60% collectively), would all be earning lower than the national average.
Top 20% earn half the disposable household income
The top quintile (20%) earn about half of all disposable household income in Canada. Perhaps people in the second quintile (top 60% to 80%) might also want and need advice. It is the second quintile is the most representative of the Canadian average. It’s this second 20% of the people that also represents about 20% of the disposable income. Beyond that point, however, many people are simply living paycheck to paycheck and saving little or nothing for down the road. Continue Reading…
Share this:
- Click to share on X (Opens in new window) X
- Click to share on LinkedIn (Opens in new window) LinkedIn
- Click to share on Facebook (Opens in new window) Facebook
- Click to share on Reddit (Opens in new window) Reddit
- Click to email a link to a friend (Opens in new window) Email
- Click to print (Opens in new window) Print
