I have long been interested in the interplay between politics and the stock market. We had a fascinating real world case study that played out in real time last month.
Those who know me will likely know that I have long been a proponent of the Efficient Market Hypothesis, which was put forward by Nobel Laureate Eugene Fama as a means of explaining capital market behaviour. It comes in three forms: weak, semi-strong, and strong: each representing different levels of market efficiency.
The Weak form asserts that all past market prices and data are fully reflected in current stock prices. Therefore, technical analysis methods, which rely on historical data, are deemed useless as they cannot provide investors with a competitive edge. However, this form doesn’t deny the potential value of fundamental analysis.
The Semi-strong form extends beyond historical prices and suggests that all publicly available information is instantly priced into the market. This includes financial statements, news releases, economic indicators, and other public disclosures. Therefore, neither technical analysis nor fundamental analysis can yield superior returns consistently.
Finally, the Strong form asserts that all information, both public and private, is fully reflected in stock prices. Even insiders with privileged information cannot consistently achieve higher-than-average market returns. This form is criticized because it conflicts with securities regulations that prohibit insider trading.
Examples supporting EMH
While the EMH has faced criticisms and challenges, it remains a prominent theory in finance that has significant implications for investors and market participants. It has been both supported and challenged by various market phenomena. Here are some notable examples supporting EMH:
Random Walk Theory: Stock prices appear to follow a ‘random walk,’ meaning past prices do not predict future movements, something that is disclosed and disclaimed on every prospectus.
Index Fund Performance: Passive index funds often outperform actively managed funds, suggesting that markets efficiently price securities, especially once fees are taken into account.
Earnings Announcements: Stock prices quickly adjust to new earnings reports, reflecting the semi-strong form of EMH.
Examples challenging EMH
The obvious example that challenges EMH is the existence of stock market bubbles. Events like the Dot-Com Bubble and the 2007-2009 Global Financial Crisis show that prices can deviate significantly from intrinsic values and for prolonged periods of time. Such anomalies suggest that while markets are generally efficient, behavioral biases and structural factors can lead to inefficiencies, include macro-level mispricings. A well-known industry chestnut is that “markets can remain irrational longer than you can stay solvent.” Here’s where the story gets interesting …< Continue Reading…
Many people like to say that passive investing doesn’t exist. However, these people make a living from active forms of investing and are just playing semantic games to distract us. Active fund managers and advisors who recommend active strategies are the main people I see claiming that passive investing doesn’t exist, but what they say isn’t true.
There is a continuum between passive and active investing; they are not absolute properties. We can reasonably call an investment approach passive even if it involves some decisions, just as we can call a person thin even if their weight isn’t zero. We may disagree on the exact threshold between passive and active investing, but the concept of passive investing still has meaning.
By “passive investing,” most people mean some form of broadly-diversified index investing with minimal trading. Although passive investing usually requires substantially less work than active investing, passive investors still have decisions to make. They need to choose an asset allocation, funds, accumulation strategy, rebalancing strategy, decumulation strategy, etc. The term “passive” comes from the fact that there is no need for day-to-day or even week-to-week decisions. It’s possible for passive investment to run on autopilot for a year without adjustment. In contrast, more active strategies need closer attention.
Threat to Active Fund Management
The rise of passive investing is a threat to active fund management. Even factor-based investing that leans toward the passive end of the continuum is threatened by more passive forms of investing. It’s hard to argue against the success of broadly-diversified index investing with minimal trading. So, rather than trying to argue in favour of more active strategies, it’s easier to meander into a pointless discussion about how passive investing doesn’t really exist. Continue Reading…
I’m just sitting on a fence
You can say I got no sense
Trying to make up my mind
Really is too horrifying
So I’m sitting on a fence
The Rolling Stones
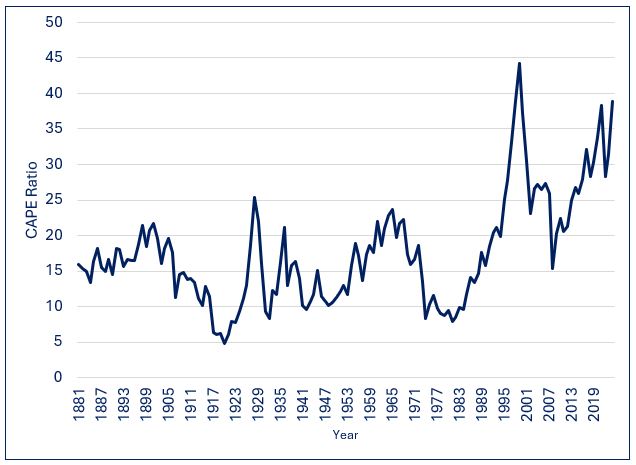
Benjamin Graham and David Dodd are universally regarded as the fathers of value investing. In their 1934 book “Security Analysis” they introduced the concept of comparing stock prices with earnings smoothed across multiple years. This long-term perspective dampens the effects of expansions as well as recessions. Yale Professor and Nobel Prize winner Robert Shiller later popularized Graham and Dodd’s approach with his own version, which is referred to as the cyclically adjusted price-to-earnings (CAPE) ratio.
S&P 500 CAPE Ratio: 1881- Present
Since 1881, the CAPE ratio for U.S. equities has spent about half of the time between 10 and 20, with an average and median value of about 16. Its all-time low of 5 occurred at the end of 1920, and its high point of 45 occurred at the end of 1999 during the height of the internet bubble.
What if I told you …. ?
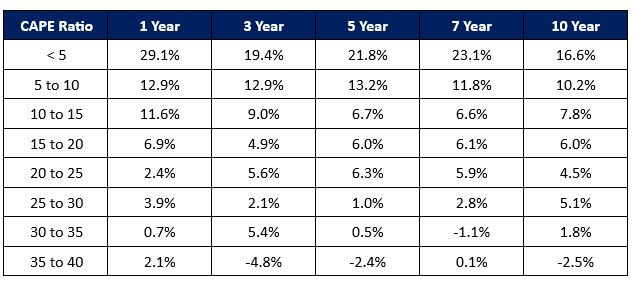
The following table shows average real (after inflation) annualized returns following various CAPE ranges.
S&P 500 Index: CAPE Ratio Ranges vs. Average Annualized Future Returns (1881 Present)
What is abundantly clear is that higher returns have tended to follow lower CAPE ratios, while lower returns (or losses) have tended to follow elevated CAPE levels. An investment strategy that entailed having above average exposure to stocks when CAPE levels were low, below average equity exposure when CAPE levels were high, and average allocations to stocks when CAPE levels were neither elevated not depressed would have resulted in both less severe losses in bear markets and higher returns over the long-term.
By no means does this imply that low CAPE ratios are always followed by periods of strong performance, nor does it imply that poor results are guaranteed following instances of elevated CAPE levels. That would be too easy!
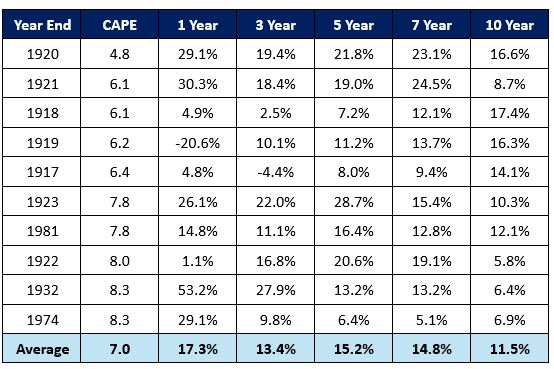
S&P 500 Index: Lowest CAPE Ratios vs. Future Real Returns (1881 – Present)
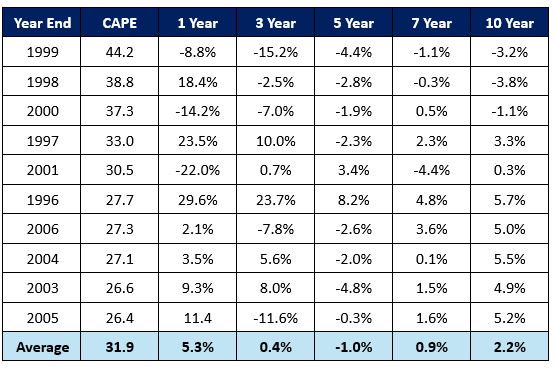
S&P 500 Index: Highest CAPE Ratios vs. Future Real Returns (1881 – Present)
Looking at the performance of stocks following extreme CAPE levels, it is clear that valuation is best used as a strategic guide rather than as a short-term timing tool. It is most useful on a time scale of several years rather than a shorter-term timing tool.
Although there have been instances where low CAPE levels have been followed by weak performance over the next 1-3 years, there have been no instances in which average annualized returns over the next 5-10 years have not been either average or above average. While it sometimes takes time for the proverbial party to get started when CAPE levels hit abnormally depressed levels, markets have without exception performed admirably over the medium to long-term.
Similarly, although there have been instances where high CAPE levels have been followed by strong performance over the next 1-3 years, there have been no instances in which average annualized returns over the next 5-10 years have not been either below average or negative. Whenever CAPE levels have been extremely elevated, it has only been a matter of time before the valuation reaper exacted its toll on markets. This brings to mind the following quote from Buffett:
“After a heady experience of that kind, normally sensible people drift into behavior akin to that of Cinderella at the ball. They know that overstaying the festivities — that is, continuing to speculate in companies that have gigantic valuations relative to the cash they are likely to generate in the future — will eventually bring on pumpkins and mice. But they nevertheless hate to miss a single minute of what is one helluva party. Therefore, the giddy participants all plan to leave just seconds before midnight. There’s a problem, though: They are dancing in a room in which the clocks have no hands.”
Be the House, Not the Chump
There have been (and inevitably will be) times when equities post strong returns for a limited time following elevated CAPE levels and instances where stocks post temporarily weak results following depressed CAPE levels.
However, successful investing is largely about playing the odds. If you were at a casino, wouldn’t you prefer to be the house rather than the chump on the other side of the table? Although chumps occasionally get lucky, this doesn’t change the fact that the odds aren’t in their favour and that they are playing a losing game. Over the long-term, investors who refrain from reducing their equity exposure when CAPE levels are elevated and don’t increase their allocations to stocks when CAPE levels are depressed will achieve satisfactory returns over extended periods. That being said, I sure wouldn’t recommend such a static approach for the simple reason that it involves suffering severe setbacks in bear markets and leaving a lot of money on the table over the long-term.
Given the historically powerful relationship between starting CAPE levels and subsequent returns, what if I told you that the CAPE ratio currently stands at 38, putting it at the top 98th percentile of all year-end observations going back over 150 years, and the top 96th percentile over the past 50 years? Presumably you would at the very least consider taking a more cautious stance on U.S. stocks.
Let’s Pretend ….
Let’s pretend that you knew nothing about the historical relationship between CAPE levels and subsequent returns. A combination of behavioural biases, speculative fervour, and FOMO (fear of missing out) might lead you to adopt an “if it isn’t broken, don’t fix it” stance of inertia.
Recency bias can give people a false sense of confidence that what has occurred in the recent past is “normal” and is therefore likely to continue in the future. Moreover, the strong returns which have occurred since the global financial crisis can exacerbate FOMO, thereby prompting investors to stay at the party (and perhaps even to imbibe more intensely by increasing their equity exposure). Lastly, the potential of innovative technologies such as AI to revolutionize businesses can capture investors’ imaginations and incite euphoria to the point where they believe that there is no price that is too high to pay for the unlimited profit potential of the “shiny new toy.”
Standing at the Crossroads
So here we stand at a crossroads, caught between the weight of history and the possibility that this time it may truly be different. What is an investor to do? One can never be 100% sure. The “right” answer will only be known in hindsight once it becomes a matter of record, at which point it will be too late for investors who get caught on the wrong side of the fence. Continue Reading…
Investing doesn’t have to be intimidating. Learn how BMO’s Asset Allocation ETFs are designed to take the complexity out of the equation, giving you an all-in-one solution that balances your portfolio without all the stress and second-guessing.
Image courtesy BMO ETFs/Getty Images
By Zayla Saunders, BMO ETFs
(Sponsor Content)
Have you ever found yourself thinking, “I really want to start investing, but where do I even begin?”
It’s easy to feel overwhelmed: between all the jargon, acronyms, and that mysterious “ticker talk” (yes you got it, those ETF symbols), it can seem like a lot to handle. Figuring out what to invest in, how much of each asset to hold, and when to rebalance? It’s enough to make anyone feel stuck, even the most analytical among us.
But here’s the thing: investing doesn’t have to be intimidating. BMO’s Asset Allocation ETFs are designed to take the complexity out of the equation, giving you an all-in-one solution that balances your portfolio without all the stress and second-guessing.
What are Asset Allocation ETFs?
Asset allocation ETFs are portfolios built with a pre-determined asset mix. Within that mix, you’ll find a variety of asset classes, like fixed income and equities, across various indexes, sectors, and countries. Instead of having to manually automate and rebalance your portfolio, these ETFs have an automated re-balance set to bring it back to your determined asset mix, for a low cost.
For example, the BMO All-Equity ETF (ZEQT) focuses on growth by allocating a higher percentage to equities, while the BMO Conservative ETF (ZCON) has a conservative approach with a higher allocation to fixed-income securities. This flexibility means that investors, whether just starting out or nearing retirement, can find a product that matches their goals.
Asset allocation ETFs provide a one-stop-shop for those looking for broad diversification, considering each investors unique goals and desired asset mix.
Solving a Problem: The Origins of Asset Allocation ETFs
To understand the popularity and importance of asset allocation ETFs, it can help to look back in time to how these useful tools came to existence. The concept was born out of a problem faced by many investors: managing a diverse investment portfolio, while sticking to their chosen asset allocation.
Imagine an investor in the early 2000s with a mix of individual stocks, bonds, and perhaps some mutual funds. Every year, they had to review their portfolio and adjust the weightings to match their evolving goals, all while considering tax implications, trading costs, and time constraints. Not only was this time-consuming, but there was also room for human error—sometimes leading to portfolios that were overly concentrated in certain sectors or regions.
The financial crisis of 2008 further highlighted the need for better portfolio management. Investors who had failed to properly diversify or rebalance suffered significant losses, while those who had a more disciplined approach weathered the storm more effectively. Recognizing these challenges, ETF providers like BMO saw an opportunity to create a product that simplified the investment process. The idea was simple but powerful: create an all-in-one ETF that would offer diversification, automatic rebalancing, and cost efficiency. By using ETFs as the building blocks, providers could offer exposure to global markets and different asset classes at a fraction of the cost of traditional mutual funds. Thus, the asset allocation ETF was born.
Source: BMO Global Asset Management, BMO Growth ETF (ZGRO:TSX), as of September 18th 2024
The portfolio holdings are subject to change without notice and may only represent a small percentage of portfolio holdings. They are not recommendations to buy or sell any particular security.
Why does the Mix Matter?
The famous Brinson, Hood, and Beebower (BHB) study, published in 1986, found that over 90% of a portfolio performance variability is driven by asset allocation, not stock picking or market timing.
This shifted how investors approach portfolio management, emphasizing the importance of diversification across asset classes for long-term success. Most asset allocation ETFs, or funds for that matter, are now built on this principle. Reinforcing the idea that asset allocation, rather than stock-picking or timing, drives the bulk of long-term investing success: a perfect fit for investors looking for a hands-off “couch-potato” way to build their wealth.
Why Asset Allocation ETFs?
Simplicity and Convenience
Asset allocation ETFs take care of the heavy lifting. With automatic rebalancing and built-in diversification, you get a hands-off investment strategy.
Diversification
These ETFs provide exposure to a broad mix of global stocks, ensuring you’re well diversified across sectors and regions, whether you prefer a conservative, growth, or somewhere in-between approach.
Cost-Effective
One of the biggest advantages of ETFs is their cost-effectiveness, and BMO asset allocation ETFs are no exception. Additionally, with fewer transactions needed to maintain the portfolio, investors can avoid high trading costs.
Long-term Focus
Asset allocation ETFs are designed with a long-term perspective in mind, making them ideal for investors focused on building wealth. By keeping a steady asset mix and rebalancing regularly, these ETFs help investors avoid emotional decision-making that often leads to buying high and selling low.
The T Series: A Tailored Solution for Retirees
One of the newer innovations in BMO’s lineup of asset allocation ETFs is the T series1, specifically designed for retirees and those nearing retirement. Retirees often face the challenge of generating a steady cash flow from their investments while minimizing the risk of running out of money. The T series solves this problem by offering a systematic withdrawal plan, allowing investors to receive monthly cash flow helping to ease retirement planning.
For example, the BMO Balanced ETF (T6 Series) (ZBAL.T) is a T series ETF designed to provide steady cash flow by investing in a balanced mix of equities and bonds. The fund pays out fixed monthly distributions (6% annualized)2 that are a blend of income and return of capital, which is especially valuable for in retirement.
Conclusion
BMO Asset Allocation ETFs offer a simple, diversified, and cost-effective solution for investors at every stage of life. Whether you’re just starting out, looking for steady growth, or planning for retirement, these ETFs provide the perfect blend of convenience and financial security. For retirees, the T series includes the benefits of consistent cashflow, making it easier to manage withdrawals during retirement.
With BMO’s asset allocation ETFs, investors can feel confident in their financial future, knowing they’ve chosen a product that aligns with their long-term goals and offers peace of mind in any market condition.
For more information visit BMO Global Asset Management to learn more.
1 T series – These units are Fixed Percentage Distribution Units that provide a fixed monthly distribution based on an annual distribution rate of 6%. Distributions may be comprised of net income, net realized capital gains and/or a return of capital. The monthly amount is determined by applying the annual distribution rate to the T Series Fund’s unit price at the end of the previous calendar year, arriving at an annual amount per unit for the coming year. This annual amount is then divided into 12 equal distributions, which are paid each month.
2 Standardized Performance: ZBAL.T, BMO Balanced ETF (T6 Series) 1 Year: 15.91%, Since Inception: 5.96% as of August 30th, 2024.
ZGRO.T, BMO Growth ETF (T6 Series) 1 Year: 18.78%, Since Inception: 14.61% as of August 30th, 2024.
Zayla Saunders is Senior Associate, Online Distribution for BMO Exchanged Traded Funds. As a member of BMO Global Asset Management’s ETF Direct Distribution Team, Zayla brings more than a decade of experience in finance. She holds the Chartered Investment Manager (CIM) designation is a graduate of the University of Manitoba. Since joining BMO in 2020, Zayla has focused on making ETF investing accessible through strategic partnerships content creation, and industry collaborations. Know for her client-focused expertise and investment knowledge, she empowers investors to make informed, confident decisions.
Disclaimer:
This article has been sponsored by BMO ETFs.

All investments involve risk. The value of an ETF can go down as well as up and you could lose money. The risk of an ETF is rated based on the volatility of the ETF’s returns using the standardized risk classification methodology mandated by the Canadian Securities Administrators. Historical volatility doesn’t tell you how volatile an ETF will be in the future. An ETF with a risk rating of “low” can still lose money. For more information about the risk rating and specific risks that can affect an ETF’s returns, see the BMO ETFs’ prospectus.
This article is for information purposes. The information contained herein is not, and should not be construed as, investment, tax or legal advice to any party. Particular investments and/or trading strategies should be evaluated relative to the individual’s investment objectives and professional advice should be obtained with respect to any circumstance.

The viewpoints expressed by the author represents their assessment of the markets at the time of publication. Those views are subject to change without notice at any time. The information provided herein does not constitute a solicitation of an offer to buy, or an offer to sell securities nor should the information be relied upon as investment advice. Past performance is no guarantee of future results. This communication is intended for informational purposes only.

Any statement that necessarily depends on future events may be a forward-looking statement. Forward-looking statements are not guarantees of performance. They involve risks, uncertainties and assumptions. Although such statements are based on assumptions that are believed to be reasonable, there can be no assurance that actual results will not differ materially from expectations. Investors are cautioned not to rely unduly on any forward-looking statements. In connection with any forward-looking statements, investors should carefully consider the areas of risk described in the most recent prospectus.

Distribution yields are calculated by using the most recent regular distribution, or expected distribution, (which may be based on income, dividends, return of capital, and option premiums, as applicable) and excluding additional year end distributions, and special reinvested distributions annualized for frequency, divided by month end net asset value (NAV). The yield calculation does not include reinvested distributions. Distributions are not guaranteed, may fluctuate and are subject to change and/or elimination. Distribution rates may change without notice (up or down) depending on market conditions and NAV fluctuations. The payment of distributions should not be confused with the BMO ETF’s performance, rate of return or yield. If distributions paid by a BMO ETF are greater than the performance of the investment fund, your original investment will shrink. Distributions paid as a result of capital gains realized by a BMO ETF, and income and dividends earned by a BMO ETF, are taxable in your hands in the year they are paid. Your adjusted cost base will be reduced by the amount of any returns of capital. If your adjusted cost base goes below zero, you will have to pay capital gains tax on the amount below zero.

Cash distributions, if any, on units of a BMO ETF (other than accumulating units or units subject to a distribution reinvestment plan) are expected to be paid primarily out of dividends or distributions, and other income or gains, received by the BMO ETF less the expenses of the BMO ETF, but may also consist of non-taxable amounts including returns of capital, which may be paid in the manager’s sole discretion. To the extent that the expenses of a BMO ETF exceed the income generated by such BMO ETF in any given month, quarter, or year, as the case may be, it is not expected that a monthly, quarterly, or annual distribution will be paid. Distributions, if any, in respect of the accumulating units of BMO Short Corporate Bond Index ETF, BMO Short Federal Bond Index ETF, BMO Short Provincial Bond Index ETF, BMO Ultra Short-Term Bond ETF and BMO Ultra Short-Term US Bond ETF will be automatically reinvested in additional accumulating units of the applicable BMO ETF. Following each distribution, the number of accumulating units of the applicable BMO ETF will be immediately consolidated so that the number of outstanding accumulating units of the applicable BMO ETF will be the same as the number of outstanding accumulating units before the distribution. Non-resident unitholders may have the number of securities reduced due to withholding tax. Certain BMO ETFs have adopted a distribution reinvestment plan, which provides that a unitholder may elect to automatically reinvest all cash distributions paid on units held by that unitholder in additional units of the applicable BMO ETF in accordance with the terms of the distribution reinvestment plan. For further information, see the distribution policy in the BMO ETFs’ prospectus.

Index returns do not reflect transactions costs, or the deduction of other fees and expenses and it is not possible to invest directly in an Index. Past performance is not indicative of future results.
The Index is a product of S&P Dow Jones Indices LLC or its affiliates (“SPDJI”), and has been licensed for use by the Manager. S&P®, S&P 500®, US 500, The 500, iBoxx®, iTraxx® and CDX® are trademarks of S&P Global, Inc. or its affiliates (“S&P”) and Dow Jones® is a registered trademark of Dow Jones Trademark Holdings LLC (“Dow Jones”), and these trademarks have been licensed for use by SPDJI and sublicensed for certain purposes by the Manager. The ETF is not sponsored, endorsed, sold or promoted by SPDJI, Dow Jones, S&P, their respective affiliates, and none of such parties make any representation regarding the advisability of investing in such product(s) nor do they have any liability for any errors, omissions, or interruptions of the Index.
The ETF referred to herein is not sponsored, endorsed, or promoted by MSCI and MSCI bears no liability with respect to the ETF or any index on which such ETF is based. The ETF’s prospectus contains a more detailed description of the limited relationship MSCI has with the Manager and any related ETF.
Commissions, management fees and expenses all may be associated with investments in exchange traded funds. Please read the ETF Facts or prospectus of the BMO ETFs before investing. The indicated rates of return are the historical annual compounded total returns including changes in unit value and reinvestment of all dividends or distributions and do not take into account sales, redemption, distribution or optional charges or income taxes payable by any unitholder that would have reduced returns. Exchange traded funds are not guaranteed, their values change frequently and past performance may not be repeated.

For a summary of the risks of an investment in the BMO ETFs, please see the specific risks set out in the BMO ETF’s prospectus. BMO ETFs trade like stocks, fluctuate in market value and may trade at a discount to their net asset value, which may increase the risk of loss. Distributions are not guaranteed and are subject to change and/or elimination.

BMO ETFs are managed by BMO Asset Management Inc., which is an investment fund manager and a portfolio manager, and a separate legal entity from Bank of Montreal.
BMO Global Asset Management is a brand name under which BMO Asset Management Inc. and BMO Investments Inc. operate.

“BMO (M-bar roundel symbol)” is a registered trademark of Bank of Montreal, used under licence.
When it comes to stocks, index investing offers many advantages over other investment approaches. However, these advantages don’t always carry over to other asset classes. No investment style should be treated like a religion, indexing included. It pays to think through the reasons for using a given approach to investing.
Stocks
Low-cost broadly-diversified index investing in stocks offers a number of advantages over other investment approaches:
Lower costs, including MERs, trading costs within funds, and capital gains taxes
Less work for the investor
Better diversification, leading to lower-volatility losses
Choosing actively-managed mutual funds or ETFs definitely has much higher costs. For investors who just pick some actively-managed funds and stick with them, the amount of work required can be low, but more often the investor stays on the lookout for better funds, which can be a lot of work for questionable benefit. Many actively-managed funds offer decent diversification. Ironically, the best diversification comes from closet index funds that charge high fees for doing little.
Investors who pick their own stocks to hold for the long term, including dividend investors, do well on costs, but typically put in a lot of work and fail to diversify sufficiently. Those who trade stocks actively on their own tend to suffer from trading losses and poor diversification, and they put in a lot of effort for their poor results. Things get worse with options.
Despite the advantages of pure index investing in stocks, I make two exceptions. The first is that I own one ETF of U.S. small value stocks (Vanguard’s VBR) because of the history of small value stocks outperforming market averages. If this works out poorly for me, it will be because of slightly higher costs and slightly poorer diversification.
One might ask why I don’t make exceptions for other factors shown to have produced excess returns in the past. The reason is that I have little confidence that they will outperform in the future by enough to cover the higher costs of investing in them. Popularity tends to drive down future returns. The same may happen to small value stocks, but they seemed to me to offer enough promise to take the chance.
The second exception I make to pure index investing in stocks is that I tilt slowly toward bonds as the CAPE10 of the world’s stocks grows above 25. I think of this as easing up on stocks because they have risen substantially, and I have less need to take as much risk to meet my goals. It also reduces my portfolio’s risk at a time when the odds of a substantial stock market crash are elevated. But the fact that I think of this measure in terms of risk control doesn’t change the fact that I’m engaged in a modest amount of market timing.
At the CAPE10 peak in late 2021, my allocation to bonds was 7 percentage points higher than it would have been if the CAPE10 had been below 25. This might seem like a small change, but the shift of dollars from high-flying stocks to bonds got magnified when combined with my normal portfolio rebalancing.
Another thing I do as the CAPE10 of the world’s stocks exceeds 20 is to lower my future return expectations, but this doesn’t include any additional portfolio adjustments.
Bonds
It is easy to treat all bonds as a single asset class and invest in an index of all available bonds, perhaps limited to a particular country. However, I don’t see bonds this way. I see corporate bonds as a separate asset class from government bonds, because corporate bonds have the possibility of default. I prefer to invest slightly more in stocks than to chase yield in corporate bonds.
I don’t know if experts can see conditions when corporate bonds are a good bet based on their risk and the additional yield they offer. I just know that I can’t do this. I prefer my bonds to be safe and to leave the risk to my stock holdings.
I also see long-term government bonds as a different asset class from short-term government bonds (less than 5 years). Central banks are constantly manipulating the bond market through ramping up or down on their holdings of different durations of bonds. This manipulation makes me uneasy about holding risky long-term bonds.
Another reason I have for avoiding long-term bonds is inflation risk. Investment professionals are often taught that government bonds are risk-free if held to maturity. This is only true in nominal terms. My future financial obligations tend to grow with inflation. Long-term government bonds look very risky to me when I consider the uncertainty of inflation over decades. Inflation-protected bonds deal with inflation risk, but this still leaves concerns about bond market manipulation by central banks.
Once we eliminate corporate bonds and long-term government bonds, the idea of indexing doesn’t really apply. For a given duration, all government bonds in a particular country tend to all have the same yield. Owning an index of different durations of bonds from 0 to 5 years offers some diversification, but I tend not to think about this much. I buy a short-term bond ETF when it’s convenient, and just store cash in a high-interest savings account when that is convenient.
Overall, I’m not convinced that the solid thinking behind stock indexing carries over well to bond investing. There are those who carve up stocks into sub-classes they like and don’t like, just as I have done with bonds. However, my view of the resulting stock investing strategies, such as owning only some sub-classes or sector rotation, is that they are inferior to broad-based indexing of stocks. I don’t see broad-based indexing of bonds the same way.
Real estate
Owning Real-Estate Investment Trusts (REITs) is certainly less risky than owning a property or two. I’ve chosen to avoid additional real estate investments beyond the house I live in and whatever is held by the companies in my ETFs. So, I can’t say I know much about REITs. Continue Reading…