Markets can be Scary but more importantly, they are Resilient
LowrieFinancial.com: Canva custom creation
By Steve Lowrie, CFA
Special to the Financial Independence Hub
Most investors understand or perhaps accept the fact that they are not able to time stock markets (sell out before they go down or buy in before they advance).
The simple rationale is that stock markets are forward looking by anticipating or “pricing in” future expectations.
While the screaming negative headlines may capture attention, stock markets are looking out to what may happen well into the future.
Timing bond markets is even harder than timing stock markets
When it comes to interest rates and inflation, my observation is that the opposite is true. Most investors seem to think they can zig or zag their bond investments ahead of interest rate changes. This is perplexing, as you can easily make the case based on evidence that trying to time bond markets is even more difficult than trying to time equity markets.
Another observation is that many investors tend to be slow to over-react. Reacting to today’s deafening headlines ignores that fact that all financial markets are extremely resilient. Whether good or bad economic news, good or bad geopolitical events, markets will work themselves out and march onto new highs, albeit sometimes punctuated by sharp and unnerving declines. Put another way, declines are temporary, whereas advances are permanent. And remember, this applies to both bond and stock markets.
It is easy to understand why we might be scared about the recent headline inflation numbers and concerned about rising interest. It is very important to keep this in context, which is what we will address today.
I see the bad moon a-risin’
I see trouble on the way
I see earthquakes and lightnin’
I see bad times today
Don’t go around tonight Well it’s bound to take your life There’s a bad moon on the rise
Creedence Clearwater Revival
The Curious Case of Missing Inflation
Image by Shutterstock/Outcome
Prior to the global financial crisis of 2008, if you had asked me what would happen if the Fed and other central banks slashed rates to zero and then left them there for over a decade, I would have told you that it wouldn’t be long before the world faced a serious inflation problem. I would have been dead wrong!
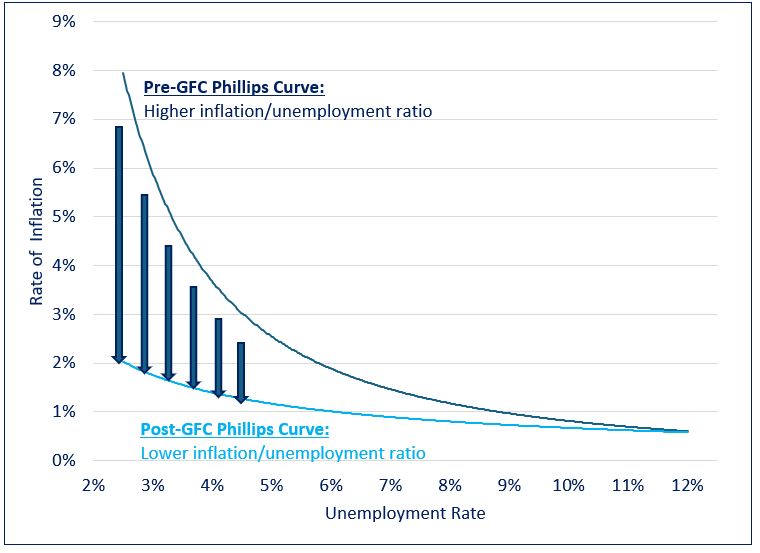
The Phillips curve is an economic concept developed by A. W. Phillips that describes the relationship between inflation and unemployment. The theory holds that there is an inverse tradeoff between the two variables. All else being equal, lower unemployment leads to higher inflation, while higher unemployment is associated with lower inflation.
Phillips’ theory proved largely resilient for most of the postwar era. However, a notable exception occurred in the years following the global financial crisis (GFC). From 2009 to 2021, despite unprecedented amounts of monetary and fiscal stimulus and record low unemployment, global prices remained unexpectedly subdued.
The Evolution of the Phillips Curve
As the chart above illustrates, in the years following the GFC the Phillips curve seemed to have shifted downward. This change allowed global economies to sustain low levels of unemployment that historically would have been accompanied by runaway inflation.
The classic unemployment vs. inflation tradeoff seemed to have vanished, leaving central bankers in the enviable position of being able to leave rates at uber stimulative levels for an extended period without spurring runaway inflation. This dynamic remained in place until 2021, when the rubber of unprecedented quantities of monetary and fiscal stimulus met the road of Covid-related supply-chain disruptions. This combination brought an abrupt end to the disinflation party of the past decade, causing central banks to raise rates at a blistering pace the likes of which had not been seen since the Volcker era of the 1980s.
Declining Interest Rates: How do love thee?
The long-term effects of low inflation and record low rates on asset prices cannot be overstated. On the earnings front, low rates make it easier for consumers to borrow money for purchases, thereby increasing companies’ sales volumes and revenues. They also enhance companies’ profitability by lowering their cost of capital and making it easier for them to invest in facilities, equipment, and inventory. Lastly, higher asset prices create a virtuous cycle: they cause a wealth effect where people feel richer and more willing to spend, thereby further spurring company profits and even higher asset prices. Continue Reading…
Stock market volatility can and will happen, which can really spook many investors.
To help with that, should you use an all-weather portfolio for changing market conditions?
Would an all-weather portfolio be best long-term?
How would I build an all-weather portfolio using Canadian ETFs?
Read on and find out our take, including the pros and cons of this all-weather investing approach.
The portfolio is designed for all seasons
If you prefer a more passive approach to investing, building an all-weather portfolio may be right for you. While this portfolio is designed to perform well during all seasons of the market, from an economic boom or bust and the messy stuff in between, we’ll see below that this approach is not without some flaws and drawbacks – just like any investing approach. Further, you could be missing out on some important aspects or assets for investing entirely.
Understanding how an all-weather portfolio works can help you to decide if this path could be right for you, or even if a blended all-weather approach could make much more sense.
What Is an All-Weather Portfolio?
Just as the name sounds, an all-weather portfolio is a portfolio that’s built to do well, regardless of changing market conditions.
This investing approach was popularized by Ray Dalio, a billionaire investor and founder of Bridgewater Associates, the largest hedge fund in the world. At the time of this post, Bridgewater currently manages over $140 billion in assets.
(FYI – this sounds very impressive of course, but we don’t invest in hedge funds and neither should you!)
Dalio’s all-weather philosophy is largely this:
Diversify your investments, hold specific asset classes in certain allocations, such that the portfolio can perform consistently throughout most economic conditions.
This includes periods of increasing volatility, rising inflation, and more. More specifically, this portfolio strategy is designed to help investors ride out four specific types of events:
Inflationary periods (rising prices)
Deflationary periods (falling prices)
Rising markets (bull/booming markets)
Falling markets (bear/busting markets)
How an All-Weather Portfolio Works
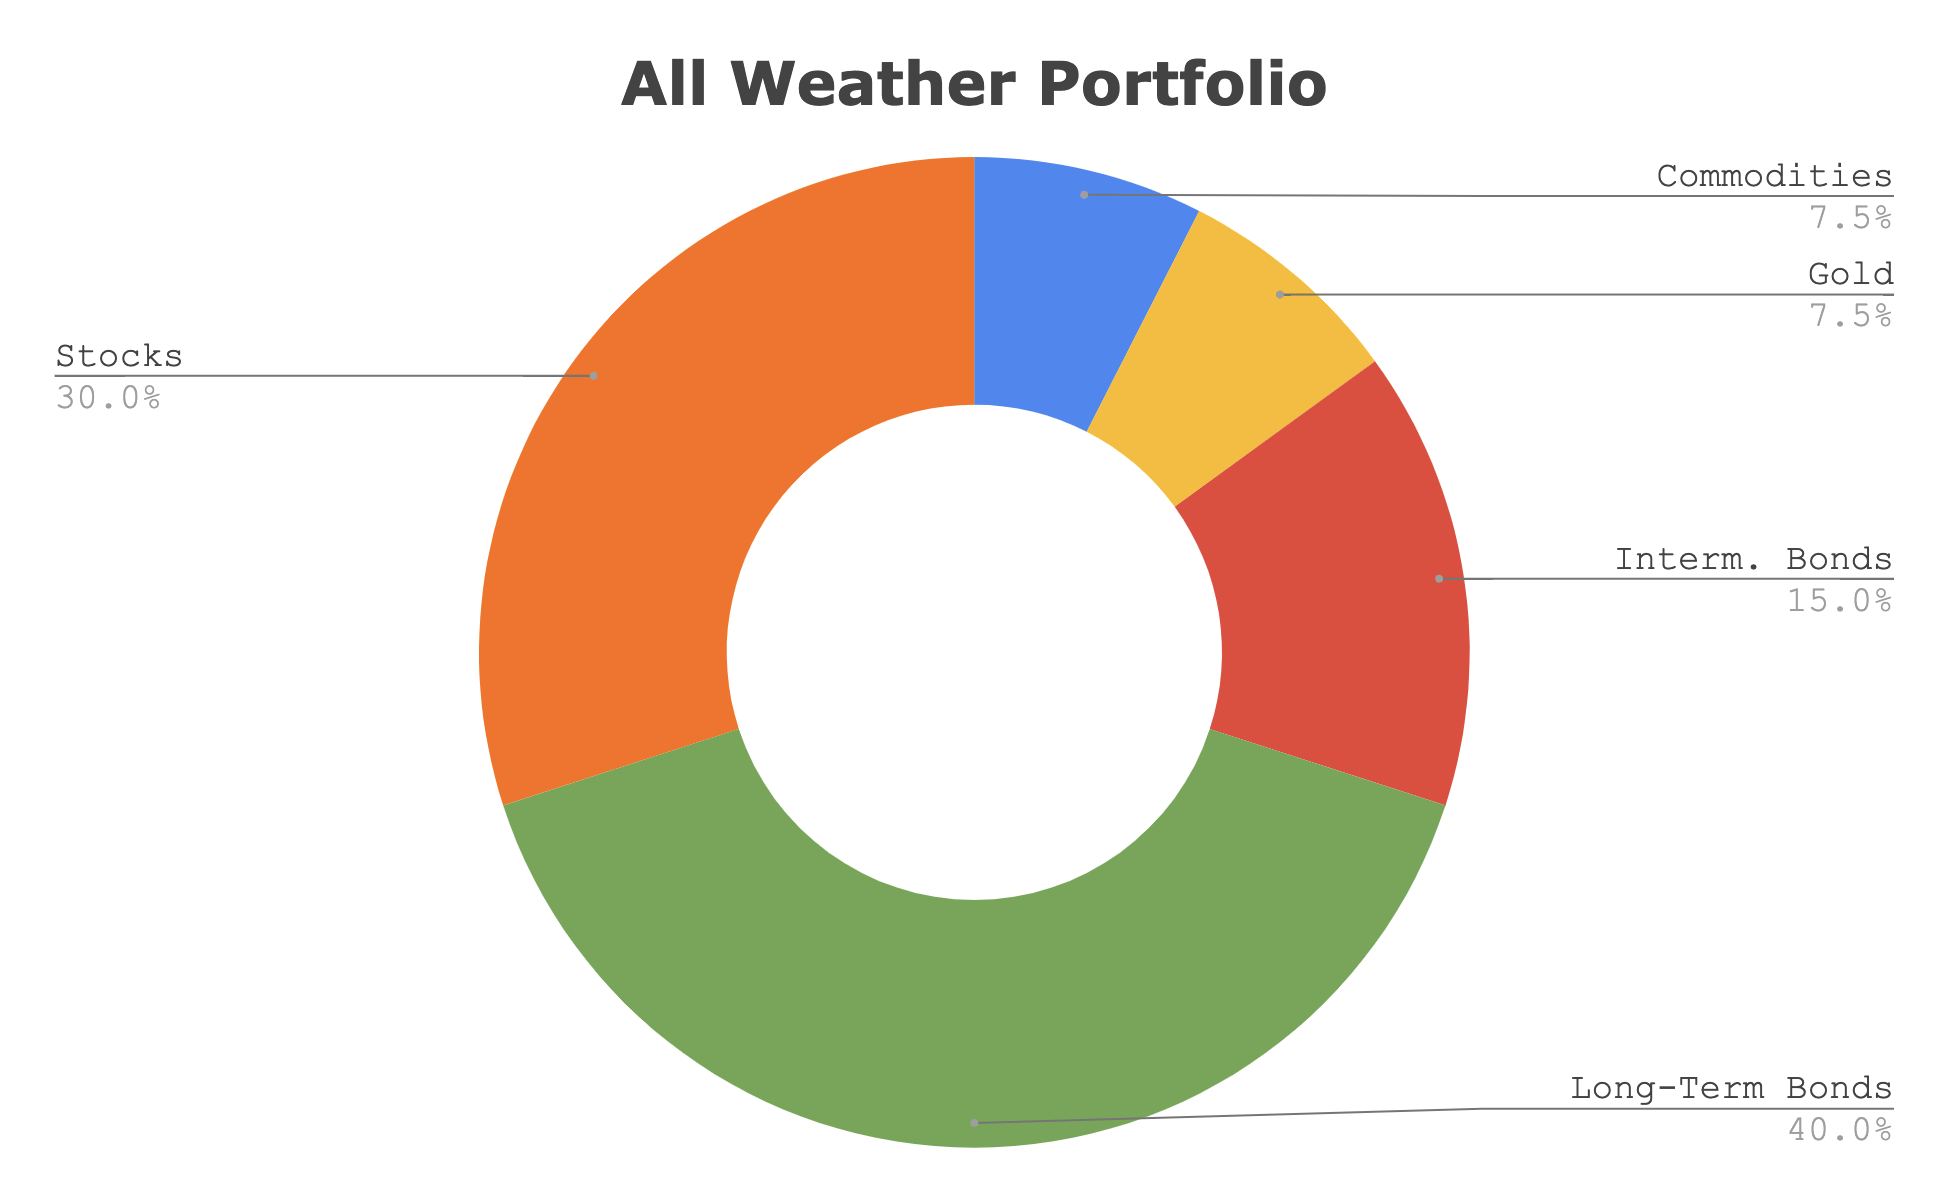
Based on back-testing, essentially Dalio and his Bridgewater team came up with a model after studying the relationship between asset class performance and changing market environments. The result of this relationship crystallized the following asset class allocation that would investors to benefit whether the market is moving up or down or sideways.
Here is the asset class breakdown:
We’ll provide more detailed funds to mimic this portfolio in a bit.
One thing you’ll realize from the portfolio above is the all-weather portfolio takes a much different approach than age-based allocations (i.e., more bonds as you get older in your portfolio), the traditional 60/40 balanced portfolio, or other popular couch potato approaches. It essentially ignores an investor’s personal need for changing risk appetite. A drawback we’ll discuss more in a bit.
The theory of the All-Weather Portfolio is that:
The equity portion will thrive in bull markets.
Commodities and gold should support the portfolio for inflation.
Bonds will help investors when stock market growth is suffering…
In a recent post we saw that the defensive sectors were twice as effective as a balanced portfolio moving through and beyond the great financial crisis. The financial crisis was the bank-failure-inspired recession and market correction of 2008-2009 and beyond. It was the worst correction since the dot com crash of the early 2000’s. Defensive sectors can play the role of bonds (and work in concert with bonds) to provide greater financial stability. With defensive sector ETFs you might be able to build a superior Canadian retirement portfolio.
The key defensive sectors are healthcare, consumer staples and utilities.
And a key chart from that post. The defensive sectors were twice as good as the traditional balanced portfolio. The chart represents a retirement funding scenario.
You can check out the original post for ideas for U.S. dollar defensive sector ETFs.
The following is for Canadian dollar accounts. Keep in mind, this is not advice. Consider this post as ‘ideas for consideration’ and part of the retirement portfolio educational process.
The yield is shown as an annual percentage as of mid March, 2023.
By Erin Allen, Vice President, Direct Distribution, BMO ETFs
(Sponsor Blog)
As of May 31, 2024, the U.S. stock market accounts for approximately 70% of the MSCI World Index1, making it a significant component of global equity markets: and likely a substantial portion of your investment portfolio as well.
While Canadian investors often favour domestic stocks for tax efficiency and lower currency risk2, incorporating U.S. stocks can enhance exposure to sectors where the Canadian market — predominated by financials and energy — falls short, particularly in technology and healthcare.
For Canadian investors looking to tap into the U.S. market affordably and without the hassle of currency conversion, there are numerous ETF options available. Here are four strategic ways to build a U.S. stock portfolio using BMO ETFs, catering to different investment objectives.
Low-cost broad exposure
If your objective is to gain exposure to a broad swath of U.S. stocks that reflect the overall market composition, the S&P 500 index is your quintessential tool.
This longstanding and highly popular benchmark comprise 500 large-cap U.S. companies, selected through a rigorous, rules-based methodology combined with a committee process, and is weighted by market capitalization (share price x shares outstanding).
The S&P 500 is notoriously difficult to outperform: recent updates from the S&P Indices Versus Active (SPIVA) report highlight that approximately 88% of all large-cap U.S. funds have underperformed this index over the past 15 years.3
This statistic underscores the efficiency and effectiveness of investing in an index that captures a comprehensive snapshot of the U.S. economy.
For those interested in tracking this index, BMO offers two very accessible and affordable options: the BMO S&P 500 Index ETF (ZSP) and the BMO S&P 500 Hedged to CAD Index ETF (ZUE), both with a low management expense ratio (MER) of just 0.09% and high liquidity.
While both ETFs aim to replicate the performance of the S&P 500 by purchasing and holding the index’s constituent stocks, they differ in their approach to currency fluctuations.
ZSP, the unhedged version, is subject to the effects of fluctuations between the U.S. dollar and the Canadian dollar. This means that if the U.S. dollar strengthens against the Canadian dollar, it could enhance the ETF’s returns, but if the Canadian dollar appreciates, it could diminish them.
On the other hand, ZUE is designed for investors who prefer not to have exposure to currency movements. It employs currency hedging to neutralize the impact of USD/CAD fluctuations, ensuring that the returns are purely reflective of the index’s performance, independent of currency volatility.
Large-cap growth exposure
What if you’re seeking exposure to some of the most influential and dynamic tech companies in the U.S. stock market, often referred to as the “Magnificent Seven?”
For investors looking to capture the growth of these powerhouse companies in a single ticker, ETFs tracking the NASDAQ-100 Index offer a prime solution. As of June 27, all of these companies are prominent members of the index’s top holdings4.
The NASDAQ-100 Index is a benchmark comprising the largest 100 non-financial companies listed on the NASDAQ stock exchange. This index is heavily skewed towards the technology, consumer discretionary, and communication sectors, from which the “Magnificent Seven” hail.
BMO offers two ETFs that track this index: the BMO Nasdaq 100 Equity Hedged to CAD Index ETF (ZQQ) and the BMO Nasdaq 100 Equity Index ETF (ZNQ). Both funds charge a management expense ratio (MER) of 0.39%. Again, the key difference between them lies in their approach to currency fluctuations.
Low-volatility defensive exposure
You might commonly hear that “higher risk equals higher returns,” but an interesting phenomenon known as the “low volatility anomaly” challenges this traditional finance theory.
Research shows that over time, stocks with lower volatility have often produced returns comparable to, or better than, their higher-volatility counterparts, contradicting the expected risk-return trade-off. Continue Reading…