Solo entrepreneurs face unique financial challenges, including inconsistent income streams, high operational costs, limited access to capital and the difficulty of separating personal and business finances. Effective financial planning becomes crucial to navigating these hurdles and ensuring sustainable business operations and long-term success.
Creating realistic budgets, building emergency funds and managing expenses allows solo entrepreneurs to stabilize their financial health. Additionally, seeking professional financial advice offers personalized strategies, tax planning and investment guidance, which are essential for securing a stable and prosperous future.
Unique financial hurdles for Solo Entrepreneurs
Variable revenue presents significant challenges for solo entrepreneurs in budgeting and managing expenses. The unpredictable nature of income makes it difficult to plan for consistent cash flow, often leading to financial strain. According to a recent survey, 77% of respondents reported their expenses increased by 6% or more due to inflation, further complicating financial planning.
Solo entrepreneurs also face the challenge of managing overhead costs without the benefit of economies of scale. Unlike larger businesses that can reduce per-unit costs through bulk purchasing, they must find ways to cover operational expenses efficiently. In fact, 37% of small businesses resort to borrowing to meet their operating expenses, which highlights the financial pressure they endure.
Securing loans and investments is another hurdle for solo entrepreneurs. Financial institutions and investors may view them as high-risk due to their lack of a proven track record and limited collateral. This makes it difficult for single proprietors to obtain the necessary funding to grow and sustain their businesses. Continue Reading…
Come gather ’round people Wherever you roam And admit that the waters Around you have grown And accept it that soon You’ll be drenched to the bone If your time to you is worth savin’ And you better start swimmin’ Or you’ll sink like a stone For the times they are a-changin’
In this month’s commentary, I will discuss both how and why the environment going forward will differ markedly from the one to which investors have grown accustomed. Importantly, I will explain the repercussions of this shift and the related implications for investment portfolios.
The Rear View Mirror: Where we’ve been
After being appointed Fed Chairman in 1979, Paul Volcker embarked on a vicious campaign to break the back of inflation, raising rates as high as 20%. His steely resolve ushered in a prolonged era of low inflation, declining rates, and the favourable investment environment that prevailed over the next four decades.
Importantly, there have been other forces at work that abetted this disinflationary, ultra-low-rate backdrop. In particular, the influence of China’s rapid industrialization and growth cannot be underestimated. Specifically, the integration of hundreds of millions of participants into the global pool of labour represents a colossally positive supply side shock that served to keep inflation at previously unthinkably well-tamed levels in the face of record low rates.
It’s all about Rates
The long-term effects of low inflation and declining rates on asset prices cannot be understated. According to Buffett:
“Interest rates power everything in the economic universe. They are like gravity in valuations. If interest rates are nothing, values can be almost infinite. If interest rates are extremely high, that’s a huge gravitational pull on values.”
On the earnings front, low rates make it easier for consumers to borrow money for purchases, thereby increasing companies’ sales volumes and revenues. They also enhance companies’ profitability by lowering their cost of capital and making it easier for them to invest in facilities, equipment, and inventory. Lastly, higher asset prices create a virtuous cycle: they cause a wealth effect where people feel richer and more willing to spend, thereby further spurring company profits and even higher asset prices.
Declining rates also exert a huge influence on valuations. The fair value of a company can be determined by calculating the present value of its future cash flows. As such, lower rates result in higher multiples, from elevated P/E ratios on stocks to higher multiples on operating income from real estate assets, etc.
The effects of the one-two punch of higher earnings and higher valuations unleashed by decades of falling rates cannot be overestimated. Stocks had an incredible four decade run, with the S&P 500 Index rising from a low of 102 in August 1982 to 4,796 by the beginning of 2022, producing a compound annual return of 10.3%. For private equity and other levered strategies, the macroeconomic backdrop has been particularly hospitable, resulting in windfall profits.
From Good to Great: The Special Case of Long-Duration Growth Assets
While low inflation and rates have been favourable for asset prices generally, they have provided rocket fuel for long-duration growth assets.
The anticipated future profits of growth stocks dwarf their current earnings. As such, investors in these companies must wait longer to receive future cash flows than those who purchase value stocks, whose profits are not nearly as back-end loaded.
All else being equal, growth companies become more attractive relative to value stocks when rates are low because the opportunity cost of not having capital parked in safe assets such as cash or high-quality bonds is low. Conversely, growth companies become less enticing vs. value stocks in higher rate regimes.
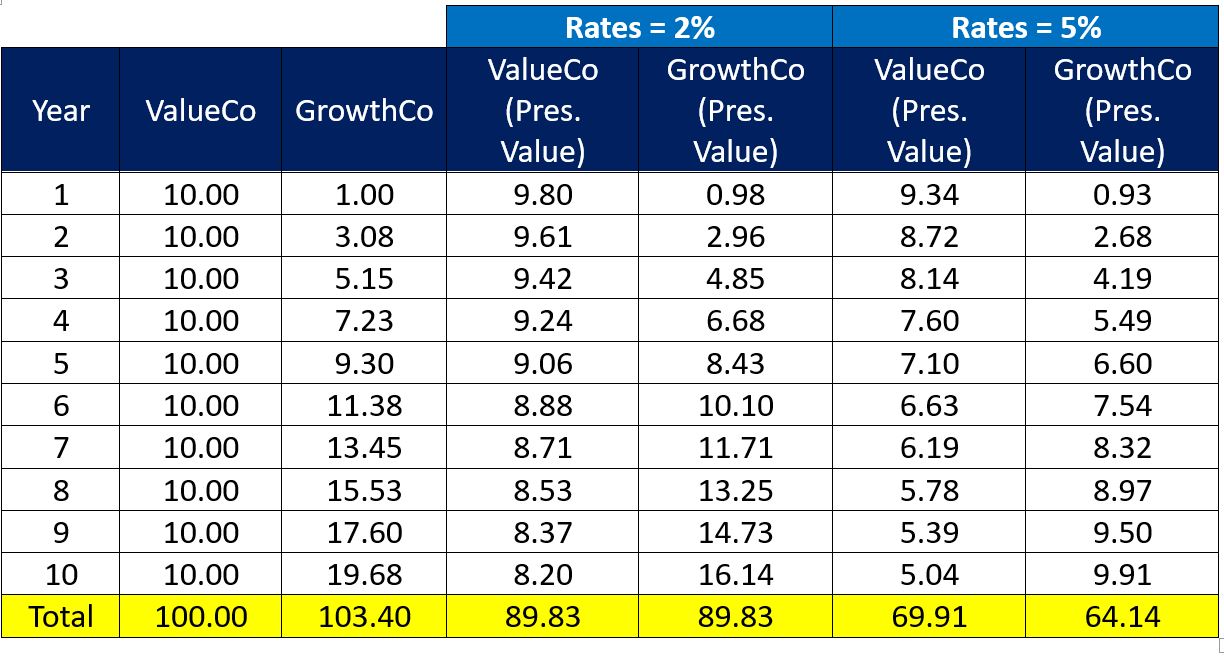
Example: The Effect of Higher Interest Rates on Value vs. Growth Companies
The earnings of the value company are the same every year. In contrast, those of the growth company are smaller at first and then increase over time.
With rates at 2%, the present value of both companies’ earnings over the next 10 years is identical at $89.83.
With rates at 5%, the present value of the value company’s earnings decreases to $69.91 while those of the growth company declines to $64.14.
With no change in the earnings of either company, an increase in rates from 2% to 5% causes the present value of the value company’s earnings to exceed that of its growth counterpart by 9%.
Losing an Illusion makes you Wiser than Finding a Truth
There are several features of the global landscape that will make it challenging for inflation to be as well-behaved as it has been in decades past. Rather, there are several reasons to suspect that inflation may normalize in the 3%-4% range and remain there for several years.
In response to rising geopolitical tensions and protectionism, many companies are investing in reshoring and nearshoring. This will exert upward pressure on costs, or at least stymie the forces that were central to the disinflationary trend of the past several decades.
The unfolding transition to more sustainable sources of energy has and will continue to stoke increased demand for green metals such as copper and other commodities.
ESG investing and the dearth of commodities-related capital expenditures over the past several years will constrain supply growth for the foreseeable future. The resulting supply crunch meets demand boom is likely to cause an acute shortage of natural resources, thereby exerting upward pressure on prices and inflation.
The world’s population has increased by approximately one billion since the global financial crisis. In India, there are roughly one billion people who do not have air conditioning. Roughly the same number of people in China do not have a car. As these countries continue to develop, their changing consumption patterns will stoke demand for natural resources, thereby exerting upward pressure on prices.
Labour unrest and strikes are on the rise. This trend will further contribute to upward pressure on wages and prices.
A Word about Debt
The U.S. government is amassing debt at an unsustainable rate, with spending up 10% on a year-over-year basis and a deficit running near $2 trillion. Following years of unsustainable debt growth (with no clear end in sight), the U.S. is either near or at the point where there are only four ways out of its debt trap:
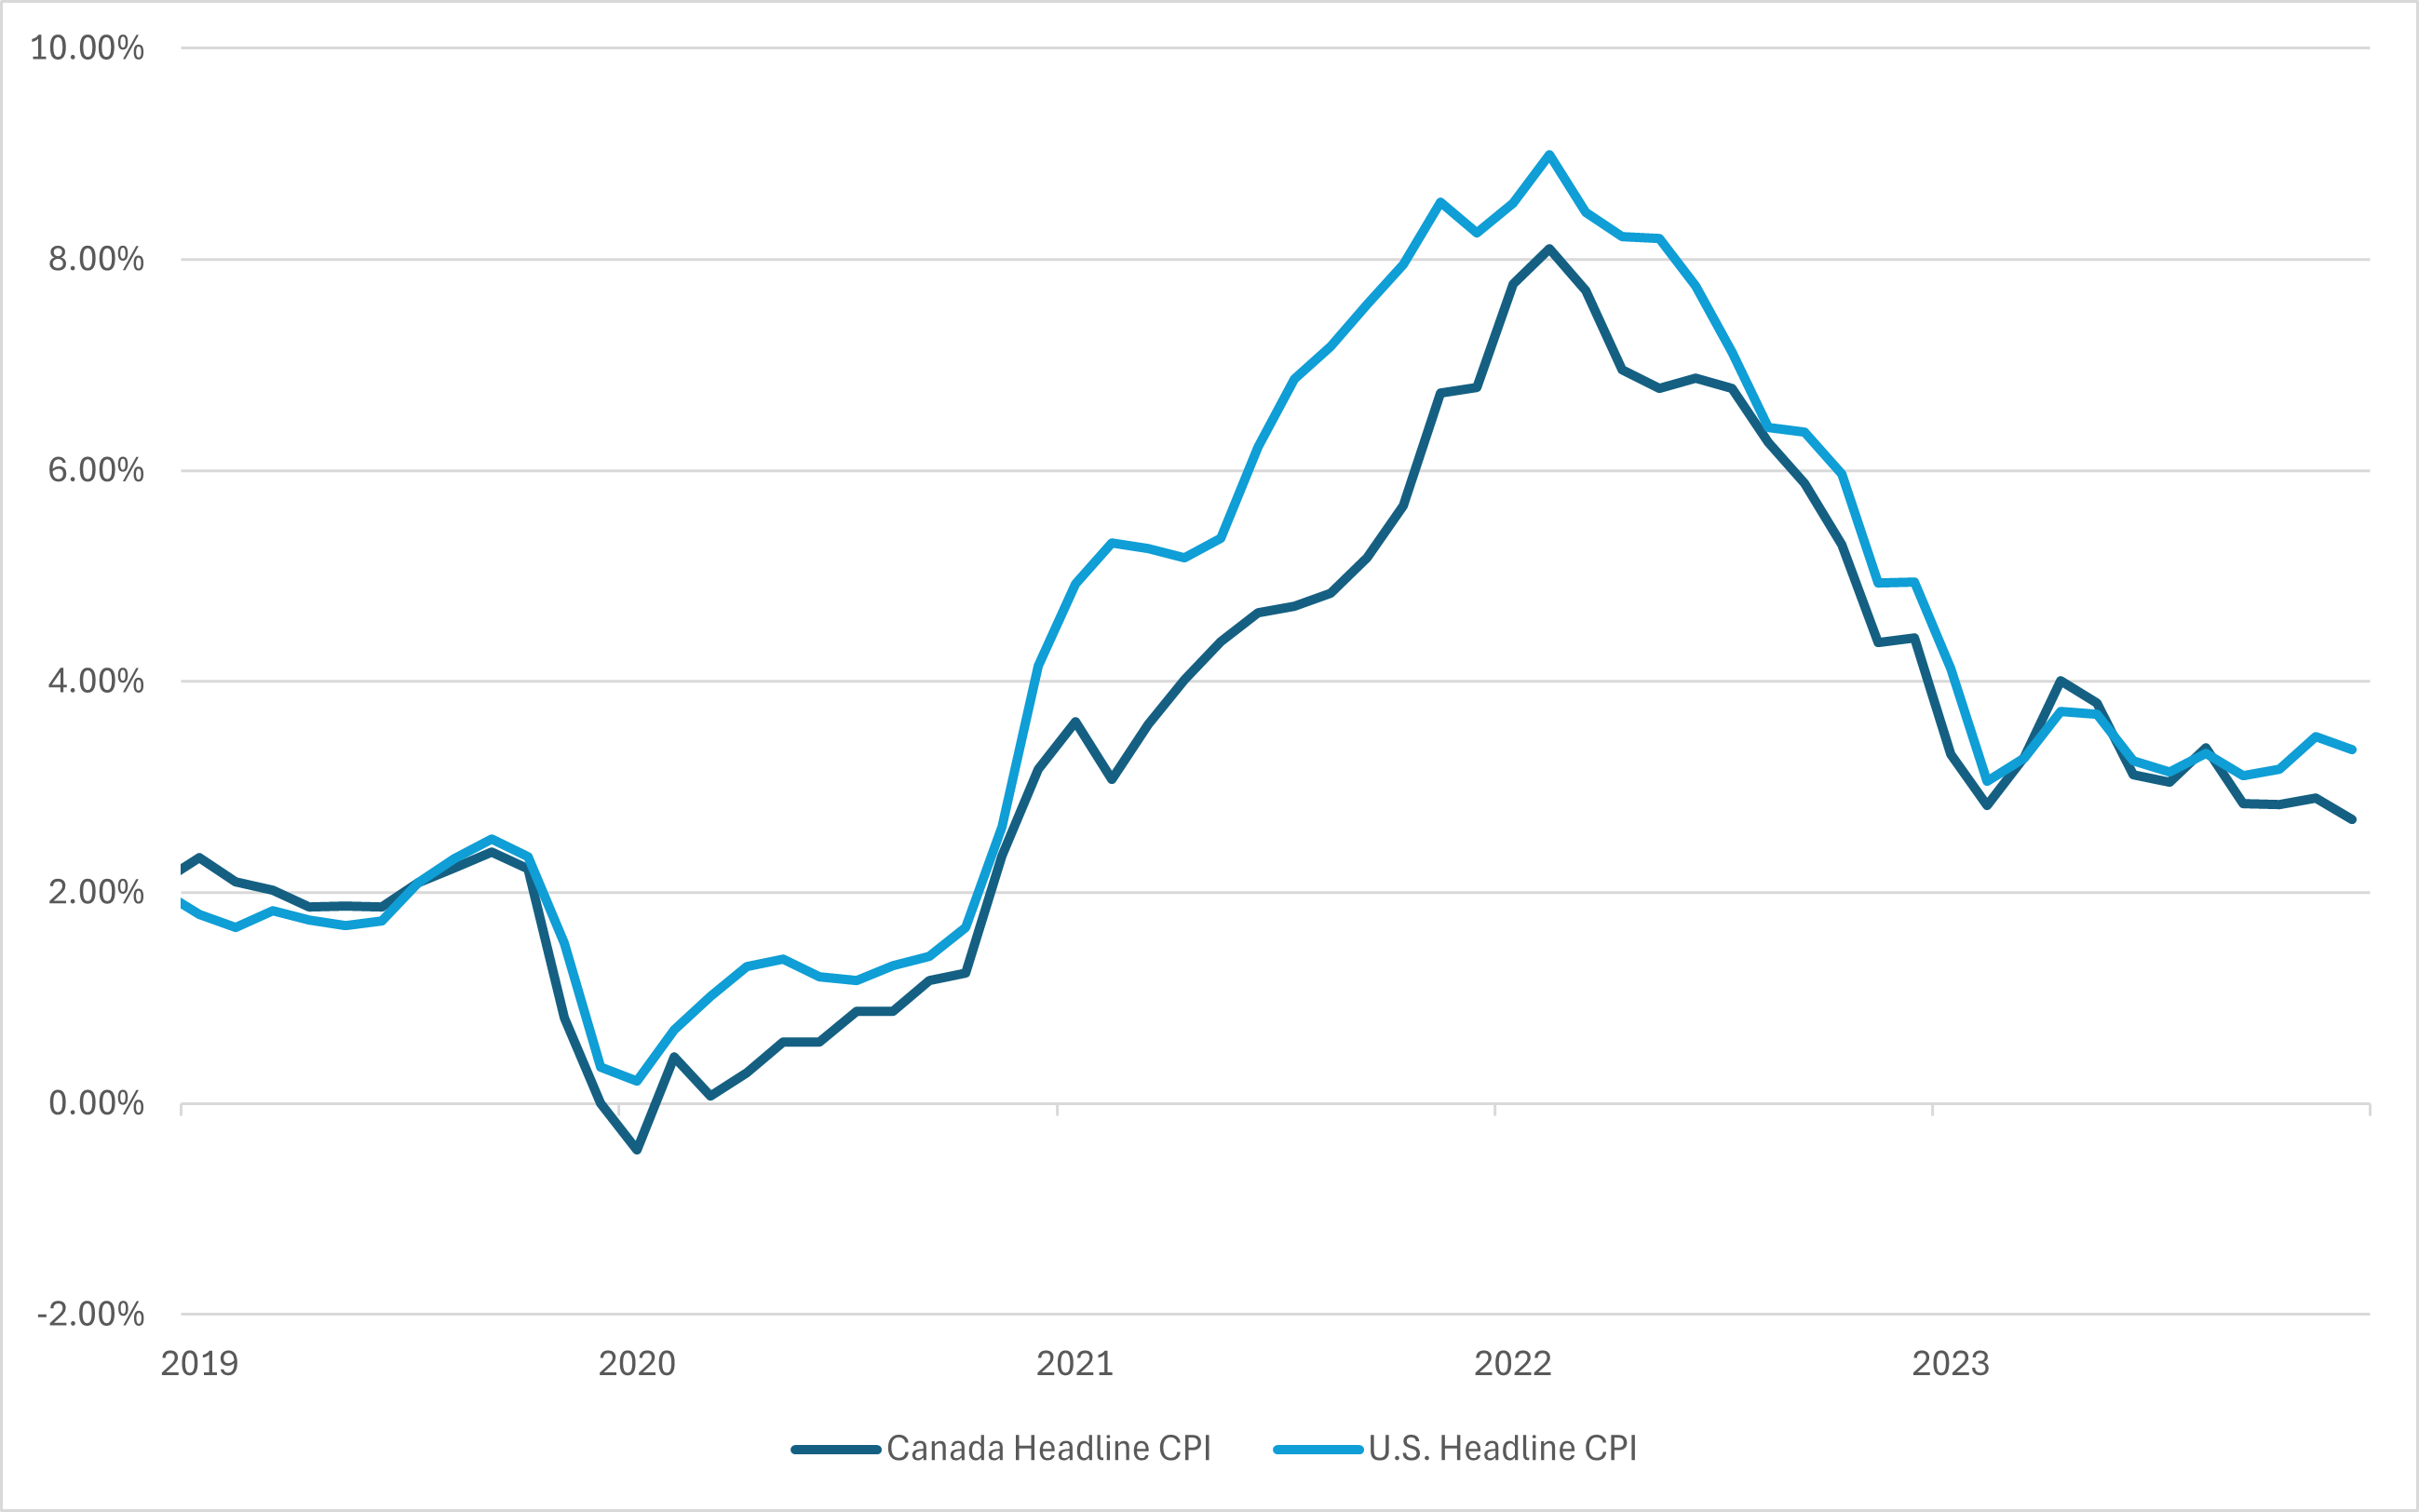
Inflation continues to be the biggest near-term driver for equity markets, given its influence on central bank decision-making regarding interest rates. Inflation rates have moderated from their peak levels; however, they remain above the 2% targets set by the Bank of Canada (BoC) and the U.S. Federal Reserve (Fed).
U.S. and Canada Inflation
As of April 30, 2024
Equity markets entered 2024 with six to seven U.S. interest rate cuts priced in over the course of 2024, with the first cut expected in March. Clearly, that did not happen. Both central banks have remained on hold, which has contributed to higher rates across the yield curve. That number has since moderated to only three cuts, and the timing of the first cut has now been pushed out to June in Canada and even later in the United States.
The effect of “higher for longer” interest rates has been particularly painful for interest rate-sensitive market sectors such as utilities and communication services. Nonetheless, pockets of the market that were expected to continue to grow have continued to advance, undeterred by the yield curve shifts.
Buoyed by hopes for a pivot in monetary policy as inflation trended closer towards the central banks’ targets, Canadian equities had a strong start to the year, although they paled compared to the ongoing boom in U.S. equities, where a large portion of the gains were derived from mega-cap information technology and related names with less representation in Canadian markets.
Mind the lag
Although decelerating, the economy continues to show sufficient resilience, with customer spending remaining robust since the reopening of economies after the global pandemic-induced shutdowns. Fiscal stimulus has moderated since the immediate aftermath of the pandemic outbreak; however, fiscal policy continues to operate at odds with monetary policy. Labour strength and wage gains have further reinforced this view, fuelling fears of lingering inflation and the potential for a higher-for-longer rate environment. Continue Reading…
The origin of the so-called 4% rule is WIlliam Bengen’s 1994 journal paper Determining Withdrawal Rates Using Historical Data. Experts often criticize this paper saying it doesn’t make sense to keep your retirement withdrawals the same in the face of a portfolio that is either running out of money or is growing wildly. However, Bengen never said that retirees shouldn’t adjust their withdrawals. In fact, Bengen discussed the conditions under which it made sense to increase or decrease withdrawals.
Bengen imagined a retiree who withdrew some percentage of their portfolio in the first year of retirement, and adjusted this dollar amount by inflation for withdrawals in future years (ignoring the growth or decline of the portfolio). He used this approach to find a safe starting percentage for the first year’s withdrawal, but he made it clear that real retirees should adjust their withdrawal amounts in some circumstances.
In his thought experiment, Bengen had 51 retirees, one retiring each year from 1926 to 1976. He chose a percentage withdrawal for the first year, and calculated how long each retiree’s money lasted based on some fixed asset allocation in U.S. stocks and bonds. If none of the 51 retirees ran out of money for the desired length of retirement, he called the starting withdrawal percentage safe.
For the specific case of 30-year retirements and stock allocations between 50% and 75%, he found that a starting withdrawal rate of 4% was safe. This is where we got the “4% rule.” It’s true that this rule came from a scenario where retirees make no spending adjustments in the face of depleted portfolios or wildly-growing portfolios. So, he advocated choosing a starting withdrawal percentage where the retiree is unlikely to have to cut withdrawals, but he was clear that retirees should reduce withdrawals in the face of poor investment outcomes. Continue Reading…
In response to rapidly accelerating inflation, central banks began raising rates aggressively at the beginning of 2022. Ever since, wild swings in bond markets have had a tremendous impact on virtually every single asset class.
This month, I examine the recent spike in rates from a historical perspective. Importantly, I will discuss the likely range of interest rates over the foreseeable future and the associated implications for financial markets.
When the Fed and other central banks were confronted with financial disaster in late 2008, they slashed interest rates to zero and deployed additional stimulative measures to ward off what many thought could be another Great Depression. Global rates then remained at levels that were both well below historical averages and the rate of inflation for the next 13 years.
In 2008, the runaway inflation of the 1980s and the painful medicine of record high rates that were required to subdue it were still relatively fresh in people’s minds. At that time, had you asked anyone what would be the most likely result of keeping rates near zero for over a decade, their most likely response would have been runaway inflation. And yet, inflation remained strangely subdued. According to most experts, this unexpected result is largely attributable to a relatively benign geopolitical climate and a related push toward global outsourcing.
This led to the notion of a “new normal” in which inflation was permanently expunged. Over the span of only 13 years, people went from fearing inflation to believing that it was a relic of the past unworthy of serious consideration. This false sense of comfort caused central banks and investors alike to be caught off guard in late 2021 when they realized that inflation had not been permanently vanquished but was merely hibernating.
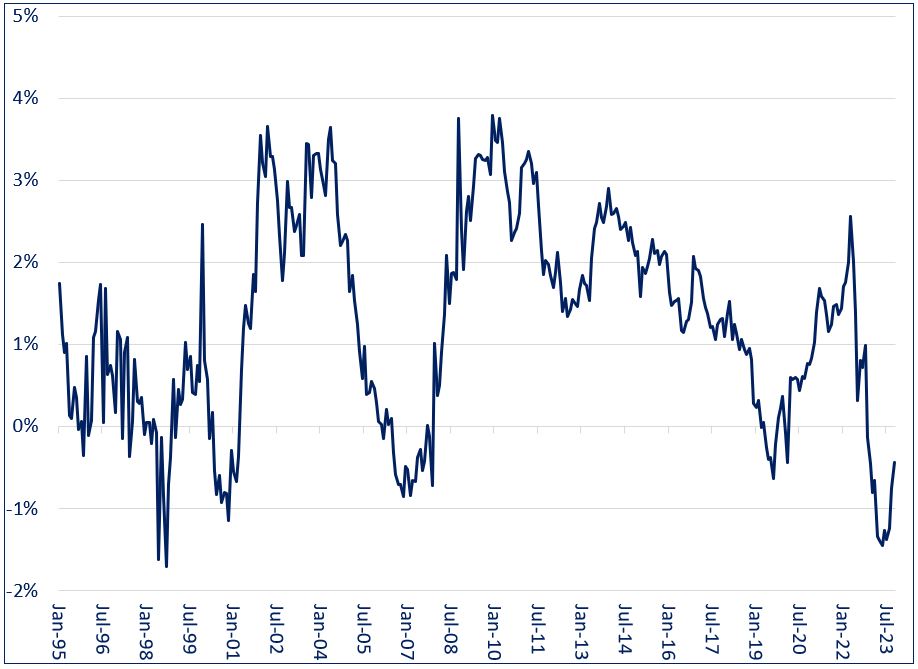
These sentiments were evident in bond markets. After rates were slashed to zero during the global financial crisis, investors were skeptical that they would remain there for long before stoking inflation. Longer-term rates remained well above their short-term counterparts, with the yield on 10-year U.S. Treasuries retaining an average 1.9% premium above the Fed Funds rate from 2009 – 2020.
However, 13 years of ultra-low rates with no sign of inflation allayed such fears, with the yield spread crossing into negative territory late last year and reaching a low of -1.5% in May of 2023. Even the rapid acceleration in inflation in late 2021 failed to fully disavow investors of the notion that the era of low inflation had come to an end, with current 10-year rates falling below their overnight counterparts.
10 U.S. Treasury Yield Minus Fed Funds Rate (1995 – Present)
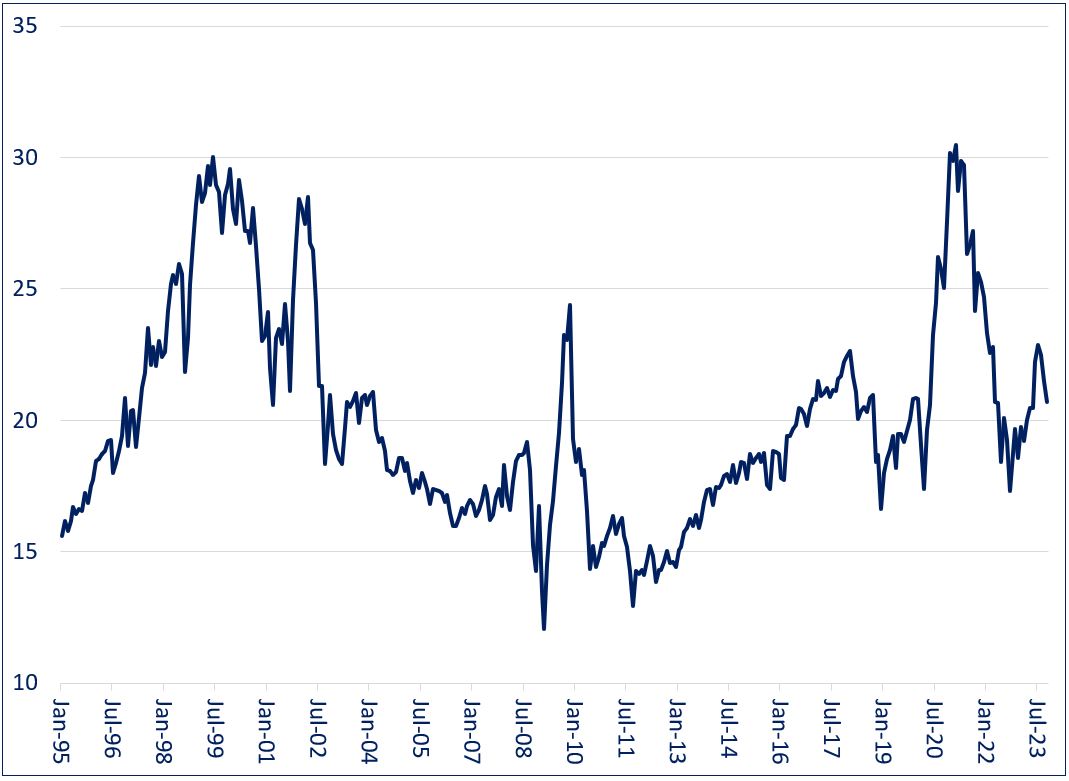
Equity markets danced to the same tune as their bond counterparts. When central banks cut interest rates to zero during the global financial crisis, investors were dubious that inflation would not soon rear its ugly head. Multiples remained relatively normal, with the P/E ratio of the S&P 500 Index averaging 16.4 for the five years beginning in 2009.
Over the ensuing several years, investors became complacent that the world would never again experience inflation issues, with the S&P 500’s P/E ratio climbing as high as 30 by early 2021. Multiples have since remained somewhat elevated by historical standards, indicating that markets have not fully embraced the fact that inflation may not be as well-behaved as what they are used to.
S&P 500 P/E Ratio (1995 – Present)
The Rising Tide of Declining Rates: Not to be Underestimated
According to legendary investor Marty Zweig:
“In the stock market, as with horse racing, money makes the mare go. Monetary conditions exert an enormous influence on stock prices. Indeed, the monetary climate – primarily the trend in interest rates and Federal Reserve policy – is the dominant factor in determining the stock market’s major direction.”
The 2,000-basis point decline in interest rates from 1980 to 2020 not only turbocharged aggregate demand (and by extension corporate revenues), but also dramatically lowered companies’ cost of capital. In tandem, these two developments were nothing short of a miracle for corporate profits and asset prices. Continue Reading…