Tag Archives: investment returns

The verdict is in: Canadian investors value financial advice

Image: Deposit Photos

By Mario Cianfarani, Vanguard Canada

Special to Financial Independence Hub

We recently conducted a “Value of Advice” survey of Canadian investors that reinforced to us how important financial advice really is. We found that while advisors enjoy high levels of client satisfaction and loyalty, younger investors are increasingly opting to manage their assets themselves through online discount brokerages and digital services.

Among Canadian investors, 44% feel their advisor provides high value, and 74% believe their financial advisor is worth every dollar they pay. Additionally, 71% say they plan to remain with their current advisor, with that figure rising to 80% among those aged 55 and over.

While these results were not surprising, the level of trust that financial advisors enjoy is changing with a cohort of younger investors. Among those aged 18-34, 40% use online platforms for investment management, while only 38% rely on financial advisors. By contrast, 70% of those over the age of 55 use a financial advisor, with only 17% turning to online platforms.

A Tale of 2 Investors

It’s clear that Canadian investors highly value financial advisors and the guidance they provide. However, there is a tale of two investors split by age in terms of the duration, method and frequency of financial advice they receive.

This presents both a challenge and opportunity for financial advisors to provide more holistic wealth management services and relationship-oriented advice to younger investors.

While younger investors are more inclined to go digital with investing, they also show a significant level of hesitation. Among younger investors, 35% report not fully trusting their financial advisor. When asked whether they can manage their own investments, many admitted to lacking the time (47%), knowledge (39%), or confidence (42%) to do so effectively.

The study highlighted that financial advisors remain the preferred source of advice for most Canadians, regardless of age. In fact, 89% of investors report that their go-to source for financial information and advice is their financial advisor or bank. Moreover, human advisors are perceived to deliver better investment returns, with 44% of respondents believing that human advisors generate higher returns, compared to only 9% who hold the same view of robo-advisors.

Almost half in regular touch with advisors feel optimistic about their financial future

The data revealed that frequent communication with clients is shown to make a significant difference in client satisfaction and optimism. Among those who communicate with their advisor monthly or more, 46% feel optimistic about their financial future, compared to just 18% of those who communicate only once a year. Additionally, 40% of those who have a financial plan created by an advisor express a high level of optimism about their financial future, compared to only 22% of those without a formal plan.

We have been looking at the impact of financial advice for more than 25 years and the utility and benefits are the same.

As the investment landscape evolves, financial advisors will need to focus on building trust, maintaining regular communication, and emphasizing the value they provide in an increasingly digital world. Doing so will enable them to serve both traditional and younger investors more effectively, today and in the future.

Mario Cianfarani is head of distribution for Vanguard Canada. Most recently, Mario was head of national accounts & institutional sales and was previously head of ETF capital markets. Before joining Vanguard in June 2015, he was a portfolio manager at First Asset Investment Management, responsible for domestic and global equity ETFs and sector-based, North American covered call ETFs. Mario has held senior sales and trading positions with a number of Canadian capital markets teams. His experience includes trading equity derivatives and marketing derivative-related risk management solutions to a broad range of clients.

Mario earned a BA in applied mathematics from York University and is a CFA® charterholder.

Is it reasonable to have irrationally high return expectations?

Image courtesy Pexels: Jakub Zerdzicki

By John De Goey, CFP, CIM

Special to Financial Independence Hub

When I ask clients and prospective clients about the return expectations they have for their portfolios, the responses vary wildly …  anywhere from ‘about 5%’ to ‘over 10%.’  Almost all of these expectations are too high.

 Admittedly, clients have different risk profiles leading to different asset allocations and ultimately, different outcomes. That’s reasonable.  A problem crops up when otherwise reasonable people have been socialized into having out-sized expectations.  How does one ethically re-calibrate expectations for irrational optimists who nonetheless think they’re within their rights to have those expectations?

The behavioural finance concept is overconfidence, although the attitude involves elements of optimism bias, cognitive dissonance and old-fashioned hubris, too. To quote J.M. Keynes: “Markets can remain irrational longer than you can remain solvent.” Few investors are prepared to acknowledge that the recent bull market seems unlikely to continue and that a recession appears to be on the horizon.

Learning from past Crashes

If we have learned anything from the great crashes of 1929, 1974, 2001 and more recently, the global financial crisis, it is that investors (often spurred by accommodative policy positions) can come to think of themselves as being all but invincible when central bankers are accommodative. Too often, they also lose their nerve when markets tumble and stay low for a prolonged period.

A good deal of personal finance is grounded in social psychology: especially group psychology.  People can get ahead through investing not only by being shrewd about valuations and such, but also by accurately anticipating how other market participants might react to a given set of circumstances.  Of course, it cuts both ways: and having reasonable expectations in the first place often assists investors in staying the course.

My concern is with the messaging being offered by many in the personal finance community these days is something I call “Bullshift.”  The industry shifts peoples’ attention to make them feel more bullish. To hear many in the business tell it, there’s no appreciable need to be concerned about high valuations, high debt levels (both public and private), a long-inverted yield curve and interest rates at generational highs.  Any one of these considerations would ordinarily give a rational investor pause. Taken together, they pose a clear and present danger for investors in the second half of 2024. Few seem concerned and it is that very lack of concern that concerns me.

Misleading investors with “Bullshift”

There is a directionally and mathematically accurate ad running by Questrade making the rounds that doesn’t tell the whole picture, either. Again, even the ‘good guys’ tend to mislead the average investor with Bullshift. The advertisement shows what you would earn over a long timeframe at 8% and what you would earn at 6%.

My question to you is simple: is it reasonable to assume an 8% return is even possible? There is longstanding evidence that higher-cost active investment strategies actually fail to outperform cheaper strategies such as passive index investing and that product cost certainly does matter. Continue Reading…

PWL Capital: Model Portfolio Returns for 2022

By Justin Bender, CFA, CFP  

Special to Financial Independence Hub

Unless you were literally born yesterday, you’re probably already aware that 2022 was an extraordinary year for investing … extraordinarily bad, that is. It hardly mattered which asset mix you invested in. Both stock and bond markets experienced double-digit losses, so even conservative investors with bond-heavy holdings saw their portfolio values plummet.

That’s investing for you. We may not like it, but we actually expect some years to serve up heaping helpings of realized risk, sometimes across the board. It’s the price we pay to expect these same markets to deliver longer and stronger runs of future returns.

From this perspective, we hope you’ll keep your eyes and your asset allocations focused on the future as we review the 2022 performance for the Vanguard, iShares, BMO, and Mackenzie asset allocation ETFs.

Before we look at the 2022 returns for our asset allocation ETFs, let’s check out the year-end results for their underlying holdings, starting with the equity ETFs.

2022 Equity ETF Returns

Canadian equity ETF returns were similar across the board, with losses of around 6%.

Disappointing, for sure, but their performance was still better than that of global stock markets, which lost 12% in Canadian dollar terms. That’s in large part due to the Canadian stock market’s overweight to energy companies. The energy sector happened to have a stellar year, returning over 50% during 2022.

U.S. equity ETFs also ended 2022 on a low note, losing around 20% in U.S. dollar terms. During this time, the U.S. dollar appreciated by 6.8% against the Canadian dollar, reducing the loss for unhedged Canadian investors. Once we factor in the return bump from U.S. dollar exposure, our selection of U.S. equity ETFs lost around 12%-14%, in Canadian dollar terms, net of withholding taxes.

BMO’s trio of U.S. equity ETFs had noticeably higher returns than the others. This is largely due to the methodology used to construct the S&P indexes tracked by BMO’s ETFs. For these indexes, an S&P index committee selects which companies to include in each index. The indexes tracked by the Vanguard, iShares, and Mackenzie ETFs have a less subjective process. This means there is more active decision-making going on in the three S&P indexes tracked by BMO’s ETFs, which led to a wider short-term return difference between BMO and the rest of the more passive index-tracking providers in 2022.

International equity ETFs ended the year on a disappointing note as well, losing between 8%-10%.

Two components explain most of the performance differences among our international ETF providers: Continue Reading…

2021 returns for retirement ETF portfolios


By Dale Roberts, cutthecrapinvesting

Special to the Financial Independence Hub

It is a common question from readers. How do I create reliable retirement income with ETFs? It is a simple answer if we consider the last 40 years. A simple mix of Canadian, U.S. and International stocks has provided the necessary growth component. Core bond funds have offered the required risk management. Stocks for offense. Bonds for defense. A typical balanced or balanced growth couch potato portfolio did the trick. Today, we’ll look at the 2021 returns for retirement ETF portfolios.

In early 2019 I posted the simple 7-ETF portfolio for retirees. Please have a read of that post for background on the ETFs, risk, and the retirement scenario.

Seek retirement and investment advice

You can self-direct your investments if you have the knowledge and you understand your risk tolerance level. But I’d suggest that you contact an experienced fee-for-service financial planner who has expertise in the retirement arena. With a fee-for-service advisor you will pay as you go. You can pay by the hour, or perhaps pay a flat fee for the evaluation and plan. You might then set off on your own to build the portfolio with all the right pieces in the right place.

I’d also suggest that you read my review of Retirement Income For Life: Spending More Without Saving More. That’s a wonderful staple read for retirees and retirement planners. The author, Frederick Vettese, was the chief actuary at Morneau Shepell.

Your retirement ETF will be one piece of the retirement funding plan. The following represents a model for consideration and evaluation.

The 7-ETF Portfolio for Canadian retirees

You may choose to go more aggressive or more conservative in your approach. And keep in mind the above is not advice, but ideas for consideration. That said, I do see it as a sensible conservative mix. You may decide to add more inflation protection by way of energy stocks or commodities.

And let’s cut to the retirement funding chase. Here’s the returns for the 7-ETF portfolio for retirees for 2021. Charts and tables are courtesy of portfoliovisualizer.com

Yup, that simple mix delivered a return of 13.8% in 2021. That is a very good return for a conservative mix that has a 45% bond allocation.

For risk and return benchmarks have a look at …

The ultimate asset allocation ETFs page.

Here’s the returns of the individual assets for 2021.

With inflation fears dominating the back half of 2021 the inflation-sensitive assets of the Canadian High Dividend VDY and REITs performed very well. Keep in mind that two of the assets are in U.S. Dollars. You can substitute and use Canadian Dollar holdings. See the original 7-ETF post.

At Questrade you will hold dual currency (U.S. and Canadian dollar) accounts. You can buy ETFs for free.

Vanguard VRIF ETF for retirement

Recently I also looked at Vanguard’s VRIF Retirement ETF. That retirement funding ETF delivered a very nice income increase for 2022.

Here’s the VRIF distribution scorecard

Distributions per share.

  • 2020 0.83
  • 2021 0.87 (4.5% increase)
  • 2022 0.94 (7.6% increase)

The portfolio income

Portfolio visualizer offers that the starting yield (2021) in the 7-ETF portfolio would be in the area of 2.8%. You will sell assets to create additional income.

Creating that retirement income

You may choose to ‘fund as you go’. While you will have portfolio income (from bonds and dividends) that is accumulating, you will likely have to sell assets to create the desired portfolio income. The basic idea of asset harvesting would be to keep the portfolio close to the original asset weighting. You do not have to be exact in this regard.

You may choose to sell assets monthly, quarterly, or you may even move the assets to a cash (ETF) at the beginning of the year to ensure that you have your retirement income for the year safely stored in cash. Of course, consider fees and taxes.

Retirement spend rate

Here’s an example of a 4.8% spend rate. That is to say, each year you would spend 4.8% of the initial total portfolio value. Each $100,000 would create $4,800 of income, before taxes, each year. A $1,000,000 portfolio would deliver $48,000 of annual income, before taxes.

The chart runs from January of 2015 to end of 2021. This is for demonstration purposes. I have not adjusted for inflation.

So the good news for this simple mix of ETFs is that you would have enjoyed a decent spend rate and the portfolio value would have increased by 17.4%. Of course it is favorable to have a buffer to weather the storms such as the great financial crisis that began in 2008, or the dot-com crash of the early 2000’s. An increasing portfolio value will offer that much-welcomed cushion.

The bonds and cash help in that regard as well – to protect against severe market corrections.

Sequence of returns risk

We need to manage the sequence of returns risk in retirement.

And keep in mind that we enter the retirement risk zone about 10 years previous to our retirement start date. We need to de-risk and prepare the portfolio well in advance.

And here is an interesting approach. You can remove sequence of returns risk (entirely) by going very conservative as you begin retirement. You would then increase your stock allocation (and growth potential) in retirement. That is called a retirement equity glidepath.

A portfolio spend rate example

Here’s an example with the 4.8% spend rate from the year 2000. That is a very unfortunate start date as 2000 is the first year of the dot-com crash. U.S. markets were down three years in a row. Canadian markets suffered as well.

We see that the Balanced Portfolio is still chugging along in 2021, while the all-equity global portfolio went to zero in 2017. We have to protect against an unfortunate start date.

Keep in mind that there are many periods when the most optimal option is an all-equity or equity-heavy portfolio that would provide greater retirement income. But with an aggressive portfolio you run the risk of retiring and running head first into a severe market correction. You don’t want to gamble and hope that you get lucky. Most retirement specialists would recommend a Balanced or Balanced Growth model. Continue Reading…

Projected Inflation and investment returns

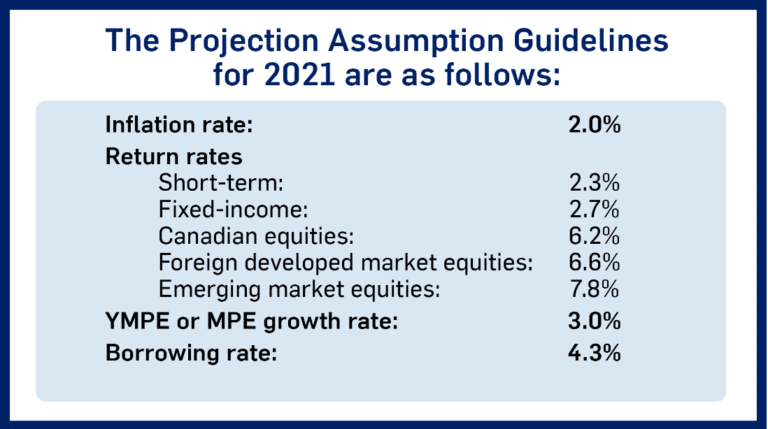
FP Canada issues guidelines every year to help financial planners make long-term financial projections for their clients that are objective and unbiased. The guidelines include assumptions to use for projected inflation and investment returns, wage growth, and borrowing rates. It also includes “probability of survival” tables that show the life expectancy at various ages.

The 2021 Projection Assumption Guidelines were of particular interest because, well, a lot has happened since the 2020 guidelines were published last spring. How should we project inflation and investment returns as we get to the other side of the pandemic and economies start opening up again?

Will we see sustained higher inflation? Should we expect any returns at all from bonds or cash? Should we lower our expectations for future stock market returns?

Remember, these are long-term projections (10+ years). That’s very different than guessing the direction of the stock market for 2021, or predicting whether we’ll see a short burst of inflation in late 2021, early 2022.

The inflation assumption of 2.0% was made by combining the assumptions from the following sources (each weighted at 25%):

  • the average of the inflation assumptions for 30 years (2019 to 2048) used in the most recent QPP actuarial report
  • the average of the inflation assumptions for 30 years (2019 to 2048) used in the most recent CPP actuarial report
  • results of the 2020 FP Canada/IQPF survey. The reduced average was used where the highest and lowest value were removed
  • current Bank of Canada target inflation rate

The result of this calculation is rounded to the nearest 0.10%

Projections for equity returns were set by combining assumptions from the following sources:

  • the average of the assumptions for 30 years (2019 to 2048) used in the most recent QPP actuarial report
  • the average of the assumptions for 30 years (2019 to 2048) used in the most recent CPP actuarial report
  • results of the 2020 FP Canada/IQPF survey. The reduced average was used where the highest and lowest value were removed
  • historic returns over the 50 years ending the previous December 31st (adjusted for inflation).

Equity return assumptions do not include fees.

Unlikely that bonds can replicate their projections of last 50 years

Projections for short-term investments and Canadian fixed-income returns included the assumptions from QPP and CPP, the results of the 2020 FP Canada/IQPF survey, but the 50-year historical average rate was removed in 2020 as a data source. This makes sense given that interest rates were significantly higher than they are now and so it would be impossible for bonds to replicate the performance of the last 50 years. Continue Reading…

Powered by the Financial Independence Hub.
© 2013-2024 All Rights Reserved.
Financial Independence Hub Logo

Sign up for our Daily Digest E-Mail!

Get daily updates from the FindependenceHub.com straight to your inbox.