By Chris Ambridge, Transcend
Special to the Financial Independence Hub
The objective for most investors is to earn value-added performance. Unfortunately there are fees and other costs that can diminish investment returns. The reality is that the costs associated with investing in these products can lead to underperformance when measured against industry standard benchmarks.
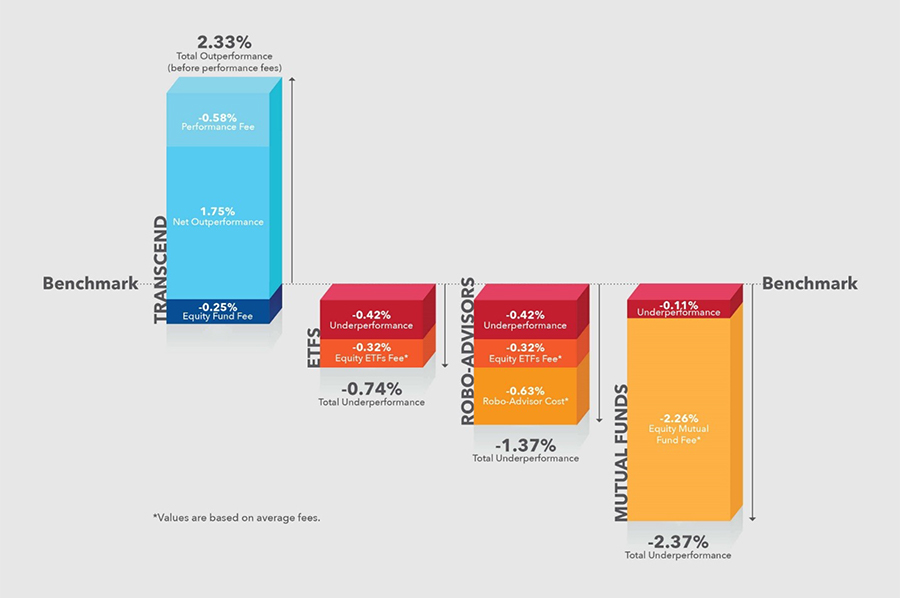
The above chart shows the average annual fees and their impact on investment performance for Equity Mutual Funds, Exchange Traded Funds (ETFs), robo-advisors and Transcend’s Pay-for-Performance™ model. This is illustrated by comparing their returns against a benchmark. The benchmark is a universally accepted representation of a particular stock market that is used to measure the performance of a portfolio manager. For example, a benchmark for Canadian equities is the S&P/TSX and a benchmark for U.S. equities is the S&P 500.
Ultimately, excessive fees reduce clients’ investment performance and hampers their ability to reach their financial goals.
While ETFs and robo-advisors are gaining in popularity, mutual funds are still the prevalent investment product for retail investors despite numerous studies that have confirmed the weak investment returns of equity mutual funds relative to their benchmarks. In Canada, a fairly new approach developed by S&P Dow Jones Indices called the SPIVA Canada Scorecard confirms performance failings. The latest result based upon five years of data ending December 2016 confirms that equity mutual funds have underperformed their benchmark, often because fees have such a negative impact on the overall portfolio results.
Mutual funds can charge management fees as well as administrative costs and custodial fees. They can also charge clients for trading, legal, audit and other operational expenses. In the chart above, these fees plus investment related underperformance add up to the average true cost (-2.37%) of investing during the last five years for equity mutual funds.
Even low-cost ETFs, which are designed to mirror a benchmark, tend to disappoint. The performance lag can be tied to the level of fees of 0.32%, plus trading and rebalancing costs as well as a potential cash balancing drag of up to 0.42%, based on 2015 data from the Management Reports of Fund Performance (MRFP) found on the SEDAR.ca website. This analysis does not include the negative impact of brokerage costs to buy and sell, and potential custodian or registration fees. With that in mind, the chart reveals that ETF investors underperform the market appropriate benchmark by -0.74%.
Robo-advisors to the rescue?
Another relatively new entrant to the low cost investment marketplace is the robo-advisor. Employing several common assumptions such as an average portfolio size of $50,000 and trading costs of 0.2% per year, it can be determined that the average robo-advisor fee in Canada is 0.63%.
This cost shows that it is more efficient than traditional wealth management fees, but still lags behind the Pay-for-Performance™ model. While everyone is talking about robo-advisors, the true question should be about getting value for your money and how much fees can impact actual outcomes. Continue Reading…


