Tag Archives: valuations

Greed, Fear and Amnesia: The importance of Cycles

Image courtesy Outcome and positivemoney.org.

By Noah Solomon

Special to the Financial Independence Hub

Investment guru Howard Marks is the founder and co-chairman of Oaktree Capital Management, the world’s largest investor in distressed securities. Since launching Oaktree in 1995, his funds have produced long-term annualized returns of 19%. According to Warren Buffett, “When I see memos from Howard Marks in my mail, they’re the first thing I open and read. I always learn something.”

As indicated by the title of his book, The Most Important Thing: Uncommon Sense for the Thoughtful Investor, Marks believes that “the most important thing is being attentive to cycles.” In particular, he discusses the importance of knowing where we stand in various cycles. He contends that most great investors have an exceptional sense for how cycles work and where in the cycle markets stand at any given time. Lastly, Marks insists that investors who disregard cycles are bound to suffer serious consequences.

We live in a World of Relativism

There is a great saying about being chased by a bear, which states “You don’t have to run faster than the bear to get away. You just have to run faster than the guy next to you.”

In the context of investing, outperformance does not necessitate perfection. Success doesn’t come from always being right, but rather from being right more often than others (or from being wrong less often). Whether picking individual stocks or tilting your portfolio more aggressively or defensively, you don’t need to be right 100% of the time; you just need to be right more than others, which by definition leads to outperformance over the long-term. To this end, we have outlined some of our favorite concepts and themes which serve as guideposts for achieving this goal.

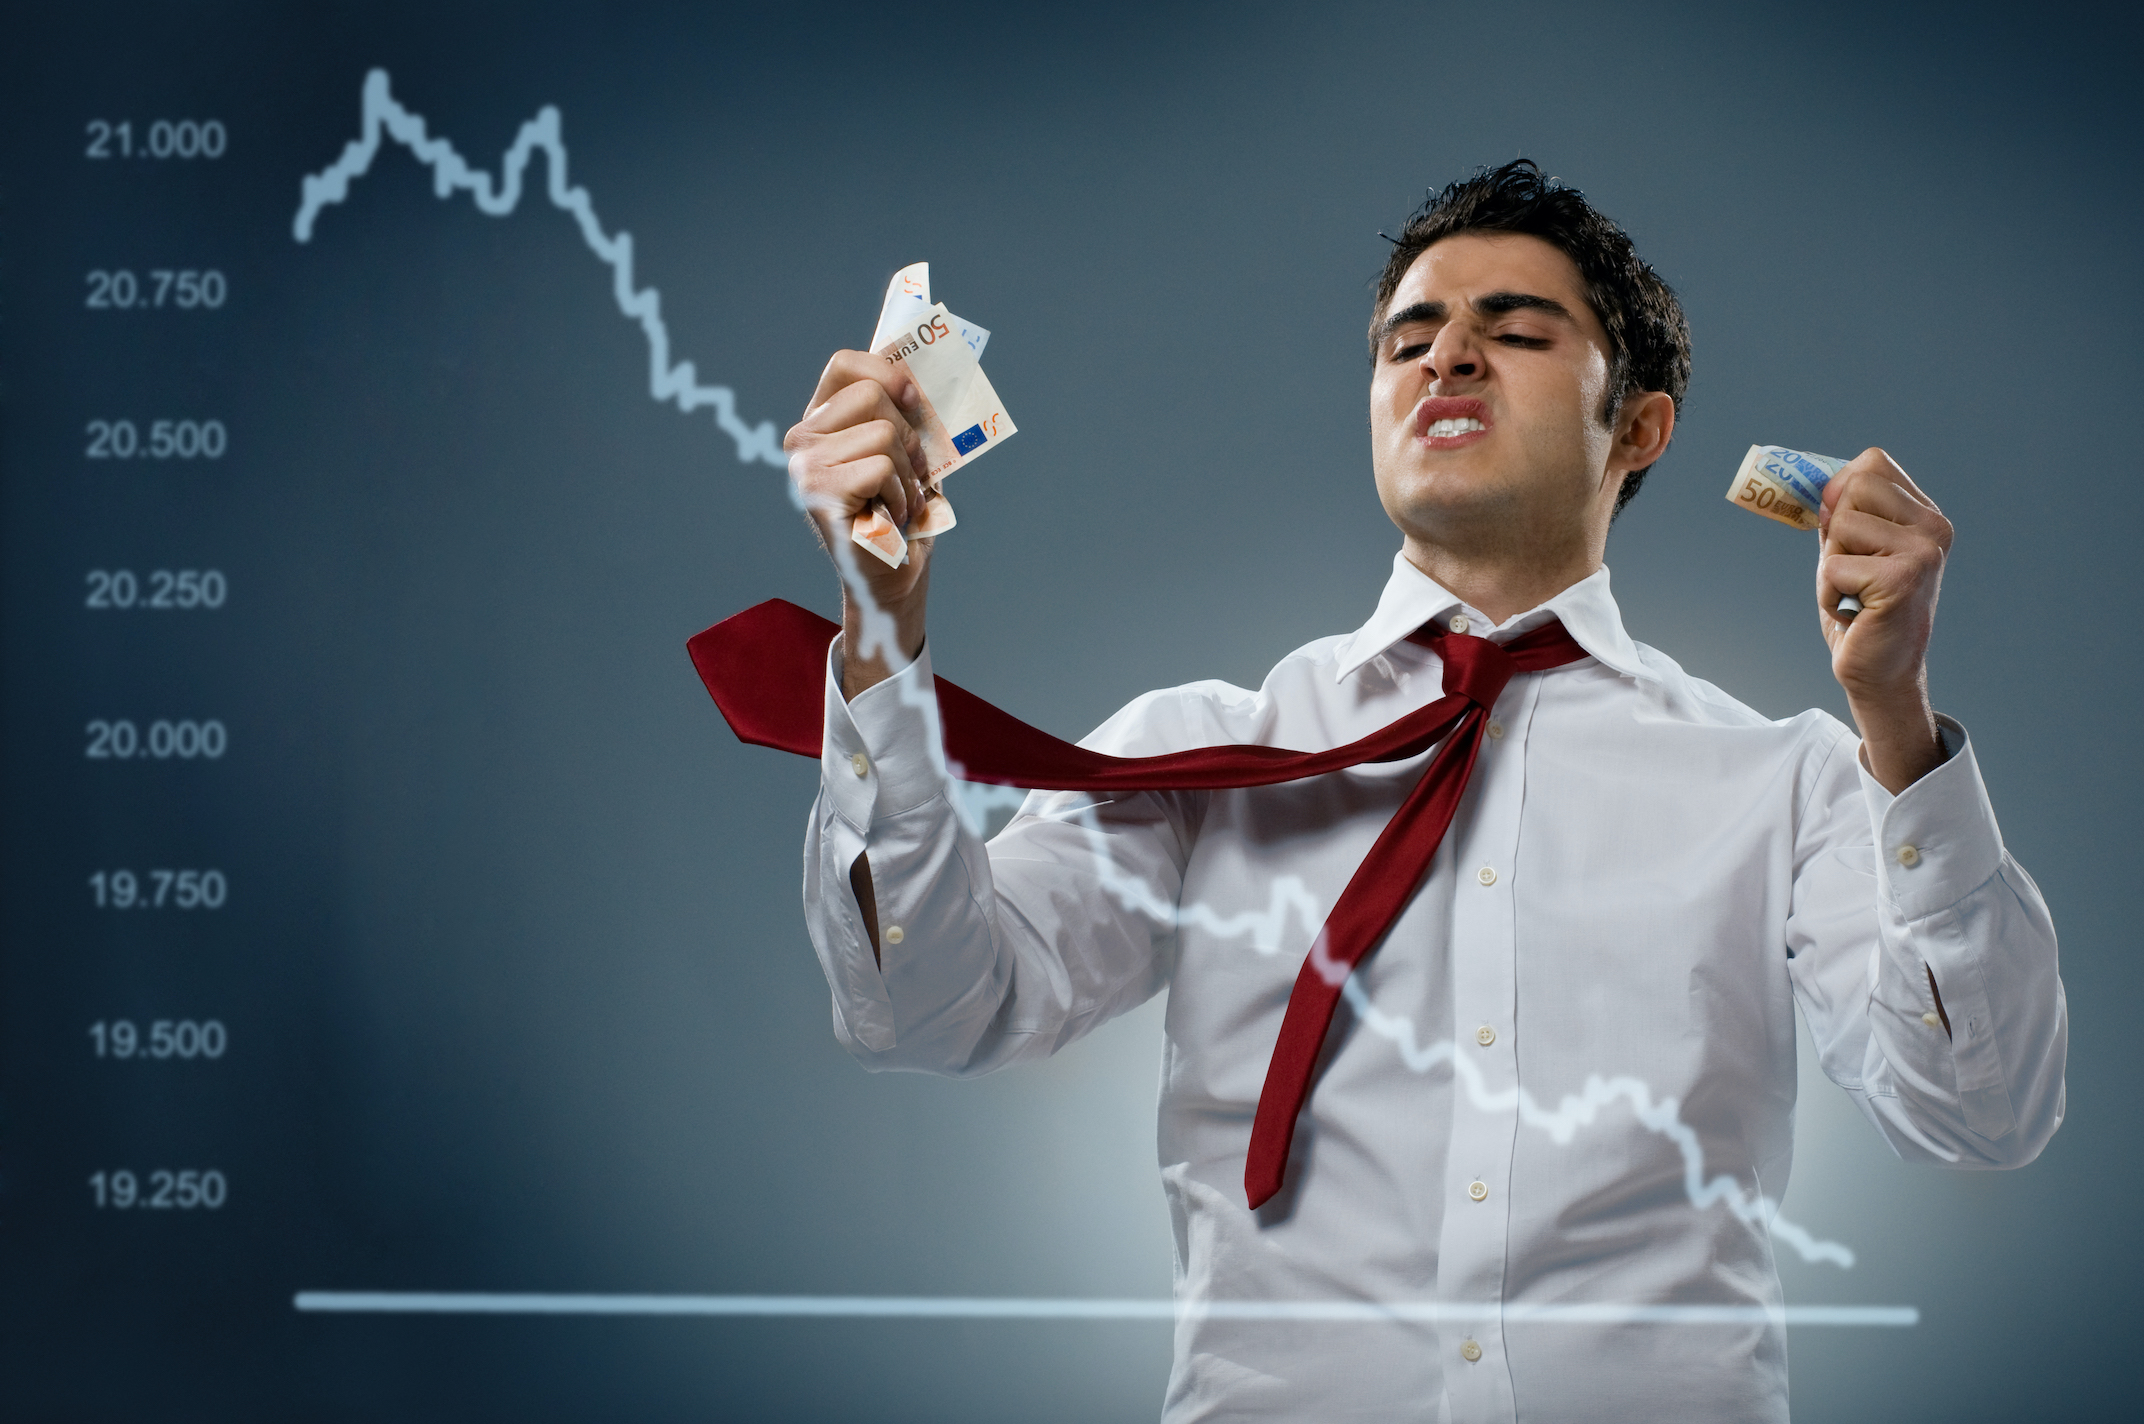
It’s all about Fear and Greed: Valuation just goes along for the Ride

The factors that drive bull and bear markets, bubbles and busts are too plentiful to enumerate. The simple fact is that more than any other factor, it is the ups and downs of human psychology that are responsible for changes in the investment environment. Most excesses on the upside and the inevitable reactions to the downside are caused by exaggerated swings in psychology.

Many investors fail to reach appropriate conclusions due to their tendencies to assess the world with emotion rather than objectivity. Sometimes they only pay attention to positive events while ignoring negative ones, and sometimes the opposite is true. It is also common for investors to switch from viewing the very same events in a positive light to a negative one within the span of only a few days (or vice-versa). Perhaps most importantly, their perceptions are rarely balanced.

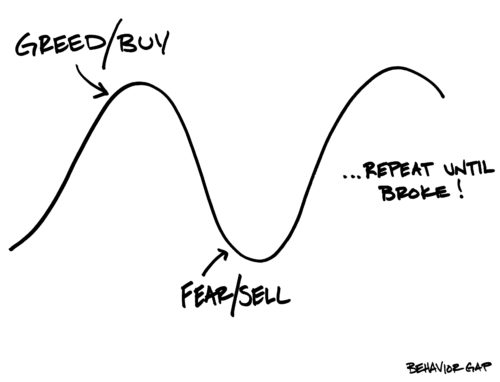
One of the most time-honored market adages states that markets fluctuate between greed and fear. Marks adds an important nuance to this notion, asserting that “It didn’t take long for me to realize that often the market is driven by greed or fear. Either the fearful or greedy predominate, and they move the market dramatically.” He adds:

Investor psychology seems to spend much more time at the extremes than it does at a happy medium. In the real world, things generally fluctuate between pretty good and not so hot. But in the world of investing, perception often swings from flawless to hopeless. In good times, we hear most people say, “Risk? What risk? I don’t see much that could go wrong: look how well things have been going. And anyway, risk is my friend – the more risk I take, the more money I’m likely to make.” Then, in bad times, they switch to something simpler: “I don’t care if I never make another penny in the market; I just don’t want to lose any more. Get me out!” Buy before you miss out gets replaced by sell before it goes to zero.

Without a doubt, valuations matter. Historically, when valuations have stood at nosebleed levels, it has been only a matter of time before misery ensued. Conversely, when assets have declined to the point where valuations were compelling, strong returns soon followed. But it is important to distinguish cause from effect. Extreme valuations (either cheap or rich) that portend bull and bear markets are themselves the result of extremes in investor psychology. Importantly, human emotions are both fickle and impossible to precisely measure. Noted physicist and Nobel Prize winner Richard Feynman articulately encapsulated this fact, stating “Imagine how much harder physics would be if electrons had feelings!”

Amnesia: The Great Enabler of Market Cycles

Another contributor to irrational investment decisions, and by extension market cycles, is the seemingly inevitable tendency of investors to engage in Groundhog Day-like behavior, forgetting the lessons of the past and suffering the inevitable consequences as a result. According to famed economist John Kenneth Galbraith, “Extreme brevity of financial memory” keeps market participants from recognizing the recurring nature of cycles, and thus their inevitability. In his book, A Short History of Financial Euphoria, he states:

When the same or closely similar circumstances occur again, sometimes in only a few years, they are hailed by a new, often youthful, and always supremely self-confident generation as a brilliantly innovative discovery in the financial and larger economic world. There can be few fields of human endeavor in which history counts for so little as the world of finance. Past experience, to the extent that it is part of memory at all, is dismissed as the primitive refuge of those who do not have the insight to appreciate the incredible wonders of the present.

Average and Normal: Not the same thing

In many ways markets resemble the swinging pendulum of a clock, which on average lies at its midpoint yet spends very little time there. Rather, it spends the vast majority of the time at varying distances to either the right or left of center. In a similar vein, most people would be surprised by both the frequency and magnitude by which stocks can deviate from their average performance, as indicated by the table below.

S&P 500 Index: Deviation from Long-Term Average (1972-2021)

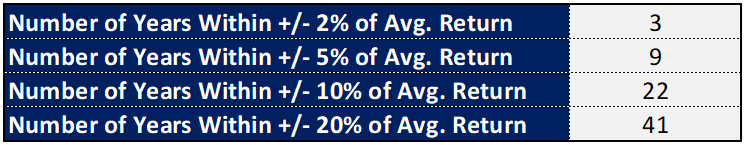
Over the past 50 years, the average annual return of the S&P 500 Index has been 12.6%. The Index fell within +/- 2% of this number in only three of these years, within +/- 5% in only nine, and within +/- 10% in 22 (still less than half the time). Lastly, the index posted a calendar year return of +/- 20% of its long-term average return in nine of the past 50 years (18% of the time).

Also, when a pendulum swings back from the far left or right, it never stops at the midpoint, but continues to the opposite extreme.  Similarly, markets rarely shift from being either overpriced or underpriced to fairly priced. Instead, they typically touch equilibrium only briefly before snowballing sentiment and resulting momentum cause a progression to the opposite extreme. Continue Reading…

No one saw it coming in 1929 either

The Roaring 20s

By John De Goey, CIM, CFP

Special to the Financial Independence Hub

Stock market bubbles are not as rare as many people think. They occurred throughout history, with multiple generations seeing large swaths of accumulated wealth evaporate in short order.  With very few exceptions, the shellshocked investors are left to survey the carnage while trying to discern what happened and why they didn’t see it coming.

There are behavioural explanations for this. They include herding (following the herd), optimism bias (my industry always says the markets will rise), recency bias (where people put too much emphasis on things that are top of mind and current), and confirmation bias (where people simply look for information that supports their own pre-existing views). There are others. It’s as if large swaths of people want to be collectively deluded into thinking the warning signs are not to be believed or – worse still – they simply refuse to acknowledge the signs at all.

Investing in a go-go market feels good until it doesn’t

If one were to choose a catch phrase for these people, it might be this – “if it feels good, do it.”  Investing in a go-go market certainly feels good. Until the day when it doesn’t. Warning people to take shelter before the pending storm is a bit of a fool’s errand, however. When times are good, people like to believe things will stay that way indefinitely.

Irving Fisher was unquestionably one of the greatest American economists of all time, but in the summer of 1929, he opined that markets had reached a state of permanently high elevation. In other words, he recognized the warning signs, but chose to dismiss and/or ignore them. The hallmarks of people getting overly optimistic about future returns were all around him and stories of shoeshine boys providing stock tips were just the tip of the iceberg for irrational investor exuberance.  Over ninety years later, little seems to have changed in how people can be duped into what amounts to a form of mass psychosis.

Jeremy Grantham is a Wall Street maven who manages billions of dollars for a firm he co-founded, GMO Capital. When asked where we are now in the market cycle, he suggested we are near a top. Grantham recently said: “Bubbles are unbelievably easy to see; it’s knowing when the bust will come that is trickier. You see it when the markets are on the front pages instead of the financial pages, when the news is full of stories of people getting cheated, when new coins are being created every month. The scale of these things is so much bigger than in 1929 or in 2000.”

Bitcoin, real estate and meme stocks

I’m just wondering, but has anyone noticed stories about bitcoin or real estate prices or the crazy trading activity in Gamestop?  Are those stories consistent with what’s been in the financial press – or do you think they seem a bit disconnected from reality?

The American stock market is in the stratosphere these days and pretty much all the rosy narratives noted about it are based in the United States. There are several metrics that demonstrate this. Warren Buffett’s favourite test is to compare total market capitalization to national GDP. The so-called “Buffett Indicator” now stands at over 200%, which is one of the highest readings of all time. In 1929, it took 22 years for stocks to recover to record highs, so the current reading certainly ought to provide pause, as another massive global downturn seems possible, if not likely. The stakes are enormous. Continue Reading…

Whose Bias is it, anyway?


One of the great benefits of living in a free society is that people can have legitimate differences of opinion about the meaning of information and best courses of action.  In this space and, more recently, on social media, I have taken to pointing out the small army of credible sources who concur with my viewpoint that markets are frothy and likely headed for a significant tumble.  Not surprisingly, there are plenty of folks who think things look rosy and that there are no significant storm clouds on the horizon at all.  Obviously, we can’t both be right.

What I find interesting is that I have critics who allege that I am guilty of confirmation bias, a behavioural economics term that suggests people only seek out evidence that supports their pre-existing viewpoint.  While I certainly acknowledge that that might be possible, I find it interesting that the people making the accusation don’t recognize that the same allegation could be levied against them just as easily.  Both sides of the ongoing debate about what might be in store on the capital markets horizon could be accused of looking primarily, perhaps even exclusively, at information that supports their preferred narrative.  How exactly does one prove that one’s thinking has been fulsome and comprehensive? Continue Reading…

How to use Statistics to Lie to yourself about a Stock Crash

By Michael J. Wiener

Special to the Financial Independence Hub

Wouldn’t it be great if we could predict the future movements of stock markets so we could capture the gains and avoid the losses?  It turns out we can’t, but that doesn’t stop people from trying.

After a Twitter exchange with John De Goey, I ended up reading the article The Remarkable Accuracy of CAPE as a Predictor of Returns by Michael Finke.  He gives a chart that appears to show we can predict the coming decade of stock returns by calculating what is known as the CAPE (Cyclically Adjusted Price-to-Earnings Ratio).

For our purposes, we don’t need to know much about the CAPE other than that it is a measure of how expensive stocks are and that it was invented by Robert Shiller, who received a Nobel Prize in Economics in 2013.  In fact, we don’t even have to calculate the CAPE ourselves; it is freely available and updated daily.

Right now, stock prices are very high.  As I write this, the CAPE for U.S. stocks stands at 37.  The only time it was higher in the past century was during the tech boom and bust around the year 2000.  We seem to be repeating the boom part, and the fear is that we may soon repeat the bust part.

Here is my reproduction of a chart similar to Finke’s chart:

Finke’s chart used nominal U.S. stock returns rather than real (inflation-adjusted) returns, but they show the same thing: an apparently close relationship between the CAPE and U.S. stock returns over the subsequent decade.  Given the current CAPE, stock returns appear to be predictable to within +/- 3% per year.  That would be amazingly accurate if true.

Based on this chart and the fact that the CAPE is currently 37, we’d expect the average annual stock return in the next 10 years to be between inflation minus 4% and inflation plus 1.5%.  If true, this would clearly mean it makes sense to sell stocks.  De Goey made his position clear in an article titled Get Out!.

Sadly, there holes in this story.  Nobel Prize winner Shiller invented the CAPE, but he isn’t involved with Finke’s paper, despite De Goey’s implication when he defended Finke’s chart saying “Oh, and the guy who came up with the concept has a Nobel Prize.”

You might wonder how the chart above has so many points when we’re talking about 10-year returns and it covers only 25 years of stock market data.  The answer is that the chart uses 300 overlapping 10-year periods.  So, each point represents a starting month.  Two successive months are likely to have nearly the same CAPE and nearly the same 10-year annual returns.  So, we get lots of bunched up dots.

But the truth is that we have very little data.  We really only have two independent 10-year periods.  Despite the impressive correlation the chart shows, we’re extrapolating from little information.

To show the problem, let’s repeat this chart for another time period:

I didn’t choose this date range at random; I selected it to make a point.  If we were to devise a strategy based on this chart, we’d say not to worry if the CAPE gets high because you’ll still get decent returns.  But when the CAPE is in the 17 to 18 range, stocks are either going on a big run, or they’ll crash, and you have to be ready to get out.  This is obviously nonsense.  It’s dangerous to try to build strategies on too little information.

Here’s a chart using S&P 500 stock data from 1936 to the present:

This data still only covers seven independent decades, but we can see the real picture of the relationship between the CAPE and stock returns is a lot fuzzier than the first chart made it seem.  We can still reasonably guess that a higher CAPE reduces future expected stock returns, but the range of returns is still wide. Continue Reading…

What about the Bond Market?

John De Goey, CFP, CIM

(Special to the Financial Independence Hub)

Over the past several months, much has been said about the stock market, and for good reason.  What can be lost in the shuffle is what has been going on concurrently in the bond market.  It’s at least as bad. Therefore, if you’re worried about stock valuations, you should probably be really, really worried about bond valuations.  There are, in my view, a lot of borderline reckless income ‘investors’ out there who hold bonds simply because of industry dogma.  Bullshift applies to bonds, too.

Some observers fear inflationary pressure on the horizon.  I’m less convinced, but still, real yields have moved higher due to both an improved growth outlook and additional expected fiscal stimulus.  Today, many people seem comfortable in referring to the environment as the ‘end of the bull market’ in bonds.  The obvious next question is: ‘does that mean we are at the beginning of a bear market in bonds?’.  To me, this is a distinct possibility.

After 40 years, interest rates can’t go much lower

For nearly 40 years, interest rates have been dropping throughout the western world.  Now, we’re at the point where, as a practical matter, they can’t really go lower.  We’re also at a point where, policy guidance from central bankers notwithstanding, rates might have to rise sooner than we thought if the inflationary pressure some expect begins to materialize. Continue Reading…