
Here are some of the ways ETFs can be used strategically to help you sleep better at night.

By Erin Allen, VP, Online Distribution, BMO ETFs
(Sponsor Blog)
Volatility is often seen as the price of admission for achieving investment returns, but too much of it can feel like paying a hefty fee for a ride on an intense roller coaster, only to find yourself feeling queasy by the end and unable to enjoy the rest of the amusement park.
If the recent stock market turbulence in early August has left you contemplating panic selling, take a moment to breathe. Market corrections are a normal and healthy aspect of investing, and your portfolio doesn’t have to experience such dramatic ups and downs.
Why? Well, various defensively oriented ETFs can offer strategic ways to manage and mitigate risk, helping you stay the course and remain invested through the market’s inevitable fluctuations. Here are some ideas featuring BMO ‘s ETFs lineup:
Low-volatility ETFs
Imagine the broad market, such as the S&P 500 index, as a vast sea where the waves represent market volatility, and your investment portfolio is your boat navigating these waters.
How your boat responds to these waves is dictated by its beta, a measure that indicates both the direction and magnitude of your portfolio’s fluctuations relative to the market.
To put it simply, if the market’s “waves” have a beta of 1, and your portfolio also has a beta of 1, this means your portfolio will typically move in sync with the market, rising and falling to the same degree.
Now, consider if your boat were lighter and more susceptible to the waves, symbolized by a beta of two. In this scenario, your portfolio would be expected to swing twice as much as the market: more pronounced highs and lows.
Conversely, imagine your boat is a sturdy cargo ship with a beta of 0.5. In this case, your portfolio would react more calmly to market waves, experiencing only half the ups and downs of the market. This stability is what low-beta stocks can offer, and they can be conveniently accessed through various ETFs.
One such example is the BMO Low Volatility Canadian Equity ETF (ZLB)1, which selects Canadian stocks for their low beta. Compared to the broad Canadian market, ZLB is overweight in defensive sectors like consumer staples and utilities, which are less sensitive to economic cycles.
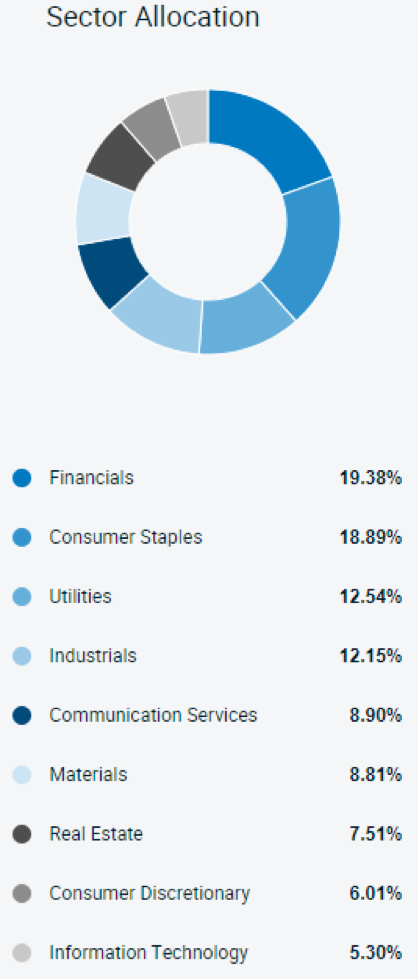
Holding allocations are as of August 19, 2024; sourced here1.
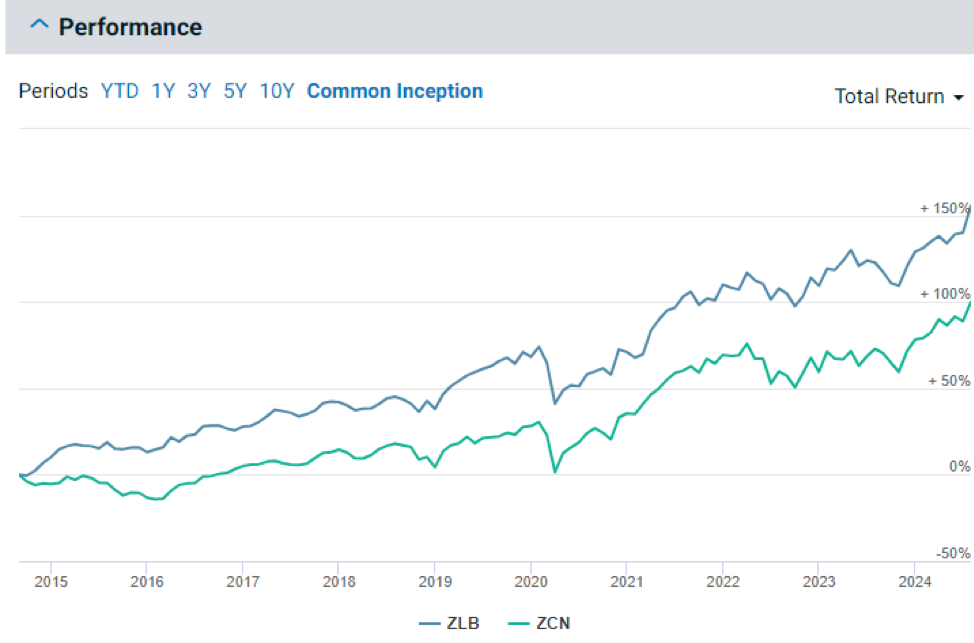
This ETF not only offers reduced volatility and smaller peak-to-trough losses compared to the BMO S&P/TSX Composite ETF (ZCN)2 but has also managed to outperform it — demonstrating that it is very much possible to achieve more return for less risk2.
To diversify further, you can also consider low-volatility ETFs from other geographic regions. These include three; BMO Low Volatility International Equity ETF (ZLD)3, BMO Low Volatility Emerging Markets Equity ETF (ZLE)4, and the BMO Low Volatility US Equity ETF (ZLU)5.
Ultra-short-term bond ETFs
While ETFs like the ZLB1 are engineered for reduced volatility through low-beta stock selection, it’s important to remember that they still hold equities.
In extreme market downturns, such as the one experienced in March 2020 during the onset of COVID-19, these funds can still be susceptible to market risk. This is pervasive and unavoidable if you’re invested in stocks; it affects virtually all equities regardless of individual company performances.
To fortify a portfolio against such downturns, diversification into other asset classes, particularly bonds, is crucial. However, not just any bonds will do — specific types, like those held by the BMO Ultra Short-Term Bond ETF (ZST)6, are particularly beneficial in these scenarios.
ZST, which pays monthly distributions, primarily selects investment-grade corporate bonds6. The focus on high credit quality, predominantly A and BBB rated bonds, is critical for reducing risk as these ratings indicate a lower likelihood of default and thus, offer greater safety during economic uncertainties.
Moreover, ZST targets bonds with less than a year until maturity6. This short duration is pivotal for those looking to minimize interest rate risk. Short-term bonds are less sensitive to changes in interest rates compared to long-term bonds, which can experience significant price drops when rates rise.
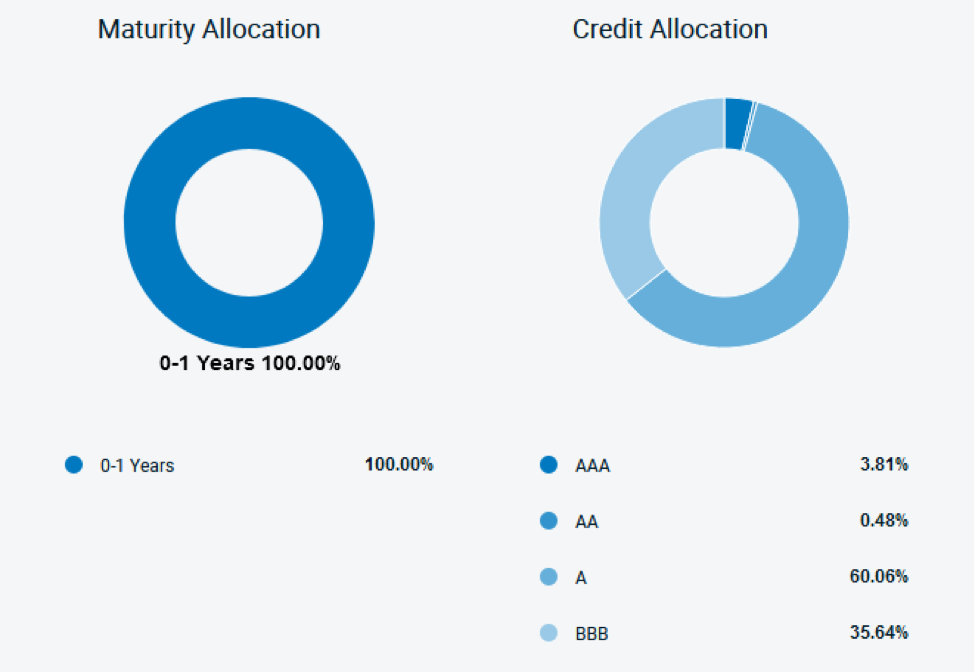
Charts as of July 31st, 2024 6
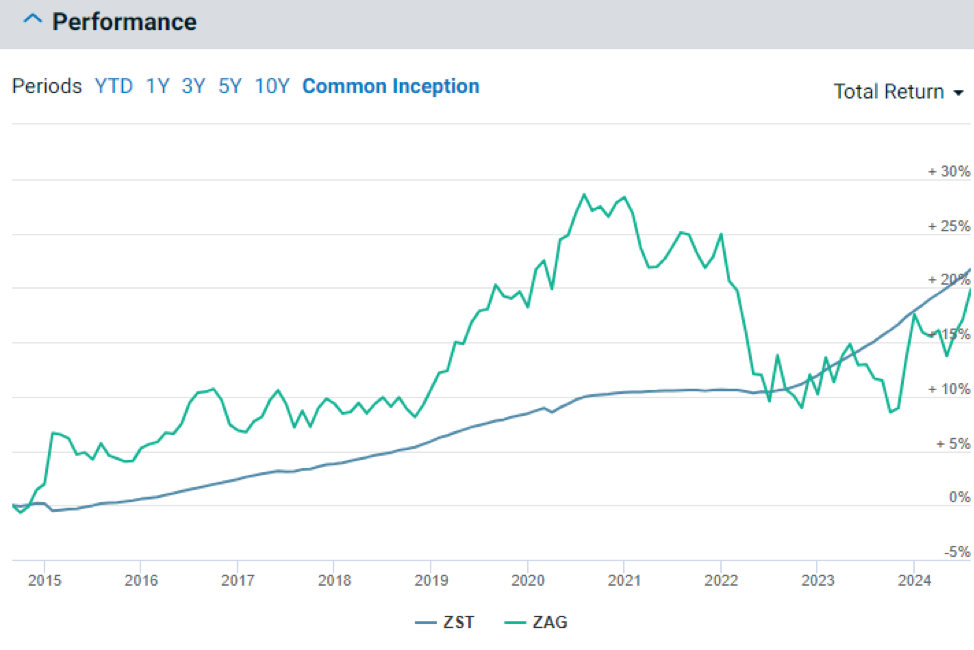
This strategic combination of high credit quality and short maturity durations7 is why, as demonstrated in the chart below, ZST has been able to steadily appreciate in value without experiencing the same level of volatility as broader aggregate bond ETFs like the BMO Aggregate Bond ETF (ZAG)8.
Buffer ETFs
If you recall the days of using training wheels when learning to ride a bike, you’ll appreciate the concept of buffer ETFs. Just as training wheels keep you from tipping over while also limiting how fast and freely you can ride, buffer ETFs aim to moderate the range of investment outcomes — both up and down.
Buffer ETFs may sound complex, but the principle behind them is straightforward. These ETFs utilize options to limit your downside risk while also capping your potential upside returns.
For example, a buffer ETF might offer to limit your exposure to a maximum 10% price return of a reference asset (like the S&P 500 index) over a year while absorbing the first -15% of any losses during the same period.
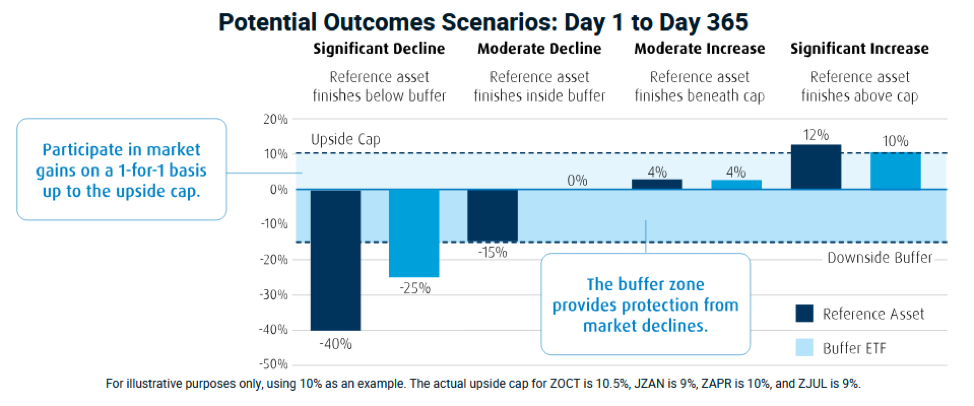
If the reference asset rises, your investment increases alongside it, up to a 10% cap. However, if the reference asset declines, the ETF absorbs the first 15% of any loss. Only after this “downside buffer” is exhausted would you start to experience losses.
BMO offers four such buffer ETFs, each named according to the start month of their outcome period when the initial upside cap and buffer limits are set. These include:
- BMO US Equity Buffer Hedged to CAD ETF – January (ZJAN)10
- BMO US Equity Buffer Hedged to CAD ETF – October (ZOCT)11
- BMO US Equity Buffer Hedged to CAD ETF – April (ZAPR)12
- BMO US Equity Buffer Hedged to CAD ETF – July (ZJUL)13
It is optimal to purchase and hold these ETFs from the start of their named month and maintain the investment throughout the year to benefit from the defined outcome and downside buffer. Buying in after the start month may mean that the remaining cap and buffer could be different, affecting the protective features of the ETF, as such due diligence is required.
 Erin Allen has been a part of the BMO ETFs team driving growth since the beginning, joining BMO Global Asset Management in 2010 and working her way through a variety of roles gaining experience in both sales and product development. For the past 5+ years, Ms. Allen has been working closely with capital markets desks, index providers, and portfolio managers to bring new ETFs to market. More recently, she is committed to helping empower investors to feel confident in their investment choices through ETF education. Ms. Allen hosts the weekly ETF Market Insights broadcast, delivering ETF education to DIY investors in a clear and concise manner. She has an honors degree from Laurier University and a CIM designation.
1 https://www.bmogam.com/ca-en/products/exchange-traded-fund/bmo-low-volatility-canadian-equity-etf-zlb/ BMO Low Volatility Canadian Equity ETF Annualized Performance NAV as of July 31st, 2024, of 14.73% 1Y, 7.98% 3Y, 9.44% 5Y, 10.26% 10Y and 12.00% Since Inception (October 21, 2011).
2 https://www.bmogam.com/ca-en/products/exchange-traded-fund/bmo-sp-tsx-capped-composite-index-etf-zcn/ BMO S&P/TSX Capped Composite Index ETF Annualized Performance NAV as of July 31st, 2024, of 15.64% 1Y, 7.66% 3Y, 10.44% 5Y, 7.39% 10Y and 8.00% Since Inception (May 29, 2009).
3 https://www.bmogam.com/ca-en/products/exchange-traded-fund/bmo-low-volatility-international-equity-hedged-to-cad-etf-zld/ BMO Low Volatility International Equity Hedged to CAD ETF Annualized Performance NAV as of July 31st, 2024, of 10.5% 1Y, 4.32% 3Y, 4.68% 5Y and 6.81% Since Inception (February 10, 2016).
4 https://www.bmogam.com/ca-en/products/exchange-traded-fund/bmo-low-volatility-emerging-markets-equity-etf-zle/BMO Low Volatility Emerging Markets Equity ETF Annualized Performance NAV as of July 31st, 2024, of 10.39% 1Y, 1.33% 3Y, 0.15% 5Y and 1.52% Since Inception (May 17, 2016).
5 https://www.bmogam.com/ca-en/products/exchange-traded-fund/bmo-low-volatility-us-equity-etf-zlu/ BMO Low Volatility US Equity ETF Annualized Performance NAV as of July 31st, 2024, of 14.40% 1Y, 9.43% 3Y, 9.24% 5Y, 12.68% 10Y and 13.74% Since Inception (March 19, 2013).
6 https://www.bmogam.com/ca-en/products/exchange-traded-fund/bmo-ultra-short-term-bond-etf-zst/ BMO Ultra Short-Term Bond ETF Annualized Performance NAV as of July 31st, 2024, of 5.76% 1Y, 3.24% 3Y, 2.50% 5Y, 2.02% 10Y and 2.06% Since Inception (January 28, 2011).
7 Duration is a measure of the sensitivity of the price of a fixed income investment to a change in interest rates. Duration is expressed as number of years. The price of a bond with a longer duration would be expected to rise (fall) more than the price of a bond with lower duration when interest rates fall (rise).
8 https://www.bmogam.com/ca-en/products/exchange-traded-fund/bmo-aggregate-bond-index-etf-zag/ BMO Low Volatility International Equity Hedged to CAD ETF Annualized Performance NAV as of July 31st, 2024, of 7.32% 1Y, -1.42% 3Y, 0.30% 5Y, 1.93% 10Y and 2.78% Since Inception (January 19, 2010).
9 https://www.bmoetfs.ca/articles/protect-gains-stay-invested-with-bmo-buffer-etfs
10 https://www.bmogam.com/ca-en/products/exchange-traded-fund/bmo-us-equity-buffer-hedged-to-cad-etf-january-zjan/ Returns are not available as there is less than one year’s performance data.
11 https://www.bmogam.com/ca-en/products/exchange-traded-fund/bmo-us-equity-buffer-hedged-to-cad-etf-october-zoct/ Returns are not available as there is less than one year’s performance data.
12 https://www.bmogam.com/ca-en/products/exchange-traded-fund/bmo-us-equity-buffer-hedged-to-cad-etf-april-zapr/Returns are not available as there is less than one year’s performance data.
13 https://www.bmogam.com/ca-en/products/exchange-traded-fund/bmo-us-equity-buffer-hedged-to-cad-etf-july-zjul/Returns are not available as there is less than one year’s performance data.
Disclaimer:
Commissions, management fees and expenses all may be associated with investments in exchange traded funds. Please read the ETF Facts or prospectus of the BMO ETFs before investing. The indicated rates of return are the historical annual compounded total returns including changes in unit value and reinvestment of all dividends or distributions and do not take into account sales, redemption, distribution or optional charges or income taxes payable by any unitholder that would have reduced returns. Exchange traded funds are not guaranteed, their values change frequently and past performance may not be repeated.

For a summary of the risks of an investment in the BMO ETFs, please see the specific risks set out in the BMO ETF’s prospectus. BMO ETFs trade like stocks, fluctuate in market value and may trade at a discount to their net asset value, which may increase the risk of loss. Distributions are not guaranteed and are subject to change and/or elimination.

BMO ETFs are managed by BMO Asset Management Inc., which is an investment fund manager and a portfolio manager, and a separate legal entity from Bank of Montreal.

Any statement that necessarily depends on future events may be a forward-looking statement. Forward-looking statements are not guarantees of performance. They involve risks, uncertainties and assumptions. Although such statements are based on assumptions that are believed to be reasonable, there can be no assurance that actual results will not differ materially from expectations. Investors are cautioned not to rely unduly on any forward-looking statements. In connection with any forward-looking statements, investors should carefully consider the areas of risk described in the most recent prospectus.

An investor that purchases Units of a Structured Outcome ETF other than on the first day of a Target Outcome Period and/or sells Units of a Structured Outcome ETF prior to the end of a Target Outcome Period may experience results that are very different from the target outcomes sought by the Structured Outcome ETF for that Target Outcome Period. Both the cap and, where applicable, the buffer are fixed levels that are calculated in relation to the market price of the applicable Reference ETF and a Structured Outcome ETF’s NAV (as Structured herein) at the start of each Target Outcome Period. As the market price of the applicable Reference ETF and the Structured Outcome ETF’s NAV will change over the Target Outcome Period, an investor acquiring Units of a Structured Outcome ETF after the start of a Target Outcome Period will likely have a different return potential than an investor who purchased Units of a Structured Outcome ETF at the start of the Target Outcome Period. This is because while the cap and, as applicable, the buffer for the Target Outcome Period are fixed levels that remain constant throughout the Target Outcome Period, an investor purchasing Units of a Structured Outcome ETF at market value during the Target Outcome Period likely purchase Units of a Structured Outcome ETF at a market price that is different from the Structured Outcome ETF’s NAV at the start of the Target Outcome Period (i.e., the NAV that the cap and, as applicable, the buffer reference). In addition, the market price of the applicable Reference ETF is likely to be different from the price of that Reference ETF at the start of the Target Outcome Period. To achieve the intended target outcomes sought by a Structured Outcome ETF for a Target Outcome Period, an investor must hold Units of the Structured Outcome ETF for that entire Target Outcome Period.

This article is for information purposes. The information contained herein is not, and should not be construed as, investment, tax or legal advice to any party. Particular investments and/or trading strategies should be evaluated relative to the individual’s investment objectives and professional advice should be obtained with respect to any circumstance.

All investments involve risk. The value of an ETF can go down as well as up and you could lose money. The risk of an ETF is rated based on the volatility of the ETF’s returns using the standardized risk classification methodology mandated by the Canadian Securities Administrators. Historical volatility doesn’t tell you how volatile an ETF will be in the future. An ETF with a risk rating of “low” can still lose money. For more information about the risk rating and specific risks that can affect an ETF’s returns, see the BMO ETFs’ prospectus .

“BMO (M-bar roundel symbol)” is a registered trademark of Bank of Montreal, used under licence.
