General

Should Millennials prioritize paying down Debt over saving for Retirement?

Image via Pexels: T. Leish

Paying down Debt versus Saving for Retirement has always been one of those conundrums facing every generation.

As a semi-retired baby boomer myself, I was a bit late to both the housing party and Retirement savings exercise.

Once I got married in my mid 30s, buying a house and paying down a mortgage was our priority, although two reasonable incomes made it possible to do both: pay off mortgage debt while also saving for retirement and enjoying some tax savings through the RRSP.

Certainly, I’ve always believed paying down debt on high credit-card interest is a priority, certainly over TFSAs. I think TFSAs are great but it’s hard to beat the guaranteed return of paying down interest being charged at 20% or so per annum.

Mercer’s latest Retirement Readiness Barometer

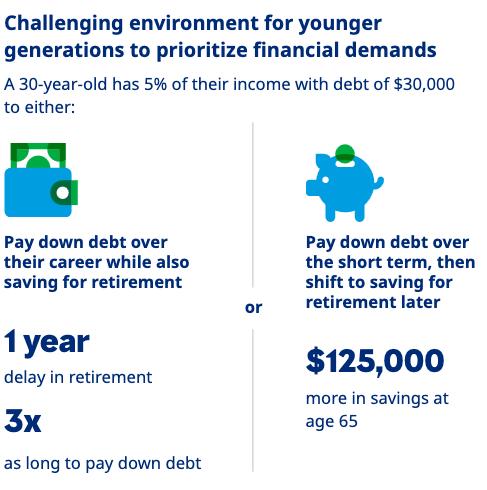
Now a new report from Mercer Canada released earlier this week — the fifth annual Mercer Retirement Readiness Barometer (MRRB) —  warns that millennials and younger Canadians who divide their disposable income between saving for retirement and paying down debts could find themselves delaying their retirement by one or two years compared to if they focused solely on paying down debt in the short term.  

The MRRB says that in today’s economic climate of elevated interest rates, a 30-year-old with $30,000 of personal (non-mortgage) debt could retire one year earlier with $125,000 more in savings if they solely focus on paying off debt within 10 years, before then shifting focus to saving for retirement. 

But if that individual instead splits disposable income between saving for retirement and paying down debt for the entire period until retirement at age 65, it can take more than three times as long to pay down the debt. 

These findings assume a 30-year-old worker is earning $70,000 and can allocate 5% of their income either to paying down debt or saving for retirement; with the interest rate on their debt being higher than the expected rate of returns of their investments. 

Higher interest rates may help retiring Boomers

Interestingly, despite the MRRB’s focus on the young, it does mention boomers near retirement age and the importance of financial literacy surrounding decisions on what to do with retirement savings as they transition into a period where they are no longer working.

The second infographic shown below shows that while high interest rates make it tougher for young people to get out of debt, boomers already at or near Retirement may find higher interest rates to be an advantage as they retire. It explains that “in an elevated interest rate environment, retirees may have windows of opportunity, although financial literacy will be required to navigate various retirement income options.”

I recently touched on this in a MoneySense Retired Money column on the need to wind up RRSPs at the end of the year you turn 71: in most cases, cashing out and paying stiff taxes is not advised, so most people either convert to a RRIF and/or  use the funds to buy a life annuity from an insurance company. Part 2 of that column will run later in April.

You can find the full Mercer release from Tuesday here.

Background on Mercer Retirement Readiness Barometer

Included is an infographic, the major elements of which I’ve reproduced below.


Continue Reading…

How to more than double your CPP benefits

While it’s well known that the longer you wait to start receiving CPP benefits, the higher the payout, a series of papers debuting today from the National Institute on Ageing (NIA) highlights the fact that:

a) Many Canadians don’t realize that CPP benefits taken at age 70 are a whopping 2.2 times what they are if taken at the earliest possible age of 60. Indeed, a 2018 Government of Canada poll found an amazing two thirds of us didn’t understand that the longer you wait, the higher the CPP payout will be.

b) Despite this fact and despite being often mentioned in media personal finance articles, most Canadians nevertheless take CPP long before age 70.

You can see at a glance in the chart shown at the top the dramatic rise in free government money that can be obtained by waiting till 70.

The paper’s lead author is   Bonnie-Jeanne MacDonald, PhD, FCIA, FSA, Director of Financial Security Research for the National Institute on Ageing at Toronto Metropolitan University.

Addressed chiefly to Canadian baby boomers, MacDonald and three contributors say upfront that deciding when to start taking CPP (or the Quebec Pension Plan) is “one of the most important retirement financial decisions they will make.”

Not only are benefits begun at age 70 2.2 times higher than they would be if taken at age 60, but “these higher payments last for life and are also indexed to inflation.”

So it’s a baffling that 90% choose to start CPP at the traditional mid-way point between these extremes: age 65.

Starting with the paper being released today, the NIA will publish seven papers in total aimed at educating consumers about these decisions.

It’s not as if most Canadians don’t already realize how important CPP will be to their income. Indeed, with traditional Employer-Sponsored Defined Benefit pension plans becoming increasingly rare outside the public sector, for many the CPP, together with Old Age Security, will be the closest many retirees will come to having a guaranteed-for-life inflation-indexed pension. According to a 2023 NIA survey on Ageing in Canada, 9 out of 10 recipients say their CPP/QPP pension is an important source of their retirement income, with 6 out of 10 saying it’s essential and they can’t live without it.

The chart below illustrates this:

The initial paper being released today observes that similar dynamics are at work in the United States with its Social Security system. Academic literature there finds that “delaying claiming is almost always the optimal decision from an economic perspective.”

CPP offsets the 2 big bogeymen of Inflation and Running out of Money

A larger CPP income obtained by waiting till 70, or at least past 65, helps new retirees address two of their biggest fears, the NIA says: Inflation and running out of money before you run out of life. It finds that 37% fret about inflation and 22% worry about running out of money in old age. Continue Reading…

Retirement Spending Experts debate 4% versus 8% withdrawal rates

By Michael J. Wiener

Special to Financial Independence Hub

On episode 289 of the Rational Reminder podcast, the guests were retirement spending researchers, David Blanchett, Michael Finke, and Wade Pfau.
The spark for this discussion was Dave Ramsey’s silly assertion that an 8% withdrawal rate is safe.  From there the podcast became a wide-ranging discussion of important retirement spending topics.  I highly recommend having a listen.


Here I collect some questions I would have liked to have asked these experts.

1. How should stock and bond valuations affect withdrawal rates and asset allocations?

It seems logical that retirees should spend a lower percentage of their portfolios when stocks or bonds become expensive.  However, it is not at all obvious how to account for valuations.  I made up two adjustments for my own retirement.  The first is that when Shiller’s CAPE exceeds 20, I reduce future stock return expectations by enough to bring the CAPE back to 20 by the end of my life.  These lower return expectations result in spending a lower percentage of my portfolio after doing some calculations that are similar to required minimum withdrawal calculations.  I have no justification for this adjustment other than that it feels about right.

The second adjustment is on equally shaky ground.  When the CAPE is above 25, I add the excess CAPE above 25 (as percentage points) to the bond allocation I would otherwise have chosen in the current year of my chosen glidepath.  Part of my reasoning is that when stock prices soar, I’d like to protect some of those gains at a time when I don’t need to take on as much risk.

Are there better ideas than these?  What about adjusting for high or low bond prices?

2. How confident can we be that the measured “retirement spending smile” reflects retiree desired spending levels?

I find that the retirement spending smile is poorly understood among advisors (but not the podcast guests).  In mathematical terms, if S(t) is real spending over time, then dS/dt has the smile shape.  Many advisors seem to think that the spending curve S(t) is shaped like a smile.  I’ve looked at many studies that examine actual retiree spending in different countries, and there is always evidence that a nontrivial cohort of retirees overspend early and have spending cuts forced upon them later.  Both overspending retirees and underspending retirees seem to have the dS/dt smile, but at different levels relative to the x-axis.  Overspenders have their spending decline quickly initially, then decline slower, and then decline quickly again.  Underspenders increase their real spending early on, then increase it slower, and finally increase it quickly at the end.

I don’t see why I should model my retirement on any data that includes retirees who experienced forced spending reductions.  The question is then how to exclude such data.  I saw in one of Dr. Blanchett’s papers that he attempted to exclude such data for his spending models.  Other papers don’t appear to exclude such data at all.  In the end, it becomes a matter of choosing how high the smile should be relative to the x-axis.  If it is high enough, the result becomes not much different from assuming constant inflation-adjusted spending. Continue Reading…

Vanguard S&P 500 is a third of my portfolio

Vanguard S&P 500


By Alain Guillot

Special to Financial Independence Hub

My investment strategy is to buy more every time I have more money. I don’t time the market. I know that investments (on the long run) will eventually go up.

No one knows when the market will tank or when it will rally. So why waste my brain energy trying to stay informed and anticipate, or react to the market? I just buy and buy some more.

When will I sell? Hopefully never, but the second best answer is: When I retire, when I need the money for personal living expenses. In that case, I will just take the money out when I need it, not when the market conditions are right (we never know when the market conditions are right).

Generally I divide my investment in three parts: 1/3 Canadian stocks, 1/3 U.S. stocks, and 1/3 international stocks.

I don’t know how much money I have made since I don’t know how to account for all the dividend payments I have been getting. But it’s a lot.

Investing in the stock market is safest way to invest your money. Yes, there is day to day volatility. If you learn how to ignore the new, the latest development, the latest emergency crisis, the latest election, you will be OK.

Of course, it’s not easy to avoid all the noise. Media companies spend billions of dollars every year finding new ways to capture your attention. The worst part is that “bad news” is a very potent attention-grabbing tool and many people fall victims of it. I have friends who have their money in cash, gold, or silver because the next financial catastrophe is coming. If they only knew how to calculate all the money they have left on the table, it’s worse than any catastrophe they have envisioned.

The bedrock of my U.S. investment is the Canadian dollar Vanguard S&P 500 Index; here is the symbol, VFV. It trades in the Toronto Stock Exchange. My strategy is to buy some more every December.

The Vanguard S&P is a fund that invests in the stocks of some of the largest companies in the United States.

This is a great investment because it’s well diversified and is made up of the stocks of the largest U.S. corporations. These large corporations tend to be stable with a solid record of profitability.

How much money can you earn?

We are not in the business of predicting the future, but here are some of the past results:

Rate of return investing on the S&P 500

As you can see the rate of return for 3 years is 42%, for 5 years is 66%, and for 10 is 304%. This is the best return you can get for your money. This is a great investment opportunity if you have the patience to wait for it.

How to invest in the Vanguard S&P 500

You can buy shared of the S&P 500 as you buy shares of any stock. Continue Reading…

Real Life Investment Strategies #2: Debunking Retirement Financial “Rules”

Should you Plan your Retirement Savings according to the 4% Withdrawal Rate Rule or 70% of Pre-Retirement Income Rule?

Lowrie Financial: Canva Custom Creation

By Steve Lowrie, CFA

Special to Financial Independence Hub

Last month, we kicked off our “Real Life Investment Strategies” series by taking on the geopolitical world. Today, we’re going to tackle an FAQ that hits closer to home.

Whether you’re an accumulator or preparing for retirement, how do you plan for saving AND spending your hard-earned cash in retirement?

My Answer: It depends.

All those popular retirement spending rules you hear about in the popular press or through your favourite financial guru really should be called guidelines. Augmenting blunt estimates with finer-pointed planning may not be as quickly accomplished. But it’s a far more effective way to plan for how much to save as you accumulate wealth, and how much to spend as you withdraw it. In fact, it’s best to consider retirement spending as being a variable process, versus a one-and-done equation.

Which is why it depends.

Let’s bend some Rules: the 4% Withdrawal Rate Rule & the 70% Pre-Retirement Income Rule

I do feel most popular retirement spending rules were made to be broken: or at least bent to fit your specific assumptions, and adjusted over time as you encounter various phases in your retirement lifestyle.

Take the 4% Retirement Rule, for example. The catchphrase has been around since 1994, when William Bengen published his Journal of Financial Planning paper, “Determining Withdrawal Rates Using Historical Data.” In it, Bengen suggested that under certain assumptions, retirees could avoid outliving their money by withdrawing no more than 4% of their wealth in the year they retire, and then adjusting this figure annually for inflation.

The 70% Retirement Rule is another popular retirement spending hack. Here you plan to spend no more than 70% of your pre-retirement income in retirement and save accordingly toward that figure. This is supposed to work because, in theory, retirees spend less in retirement to fulfill their lifestyle wants and needs.

There are many similar shortcuts for guesstimating your retirement numbers. It’s tempting to accept these simplified rules as close enough and assume they’re all you’ll need to proceed. But the thing is, while Bengen’s analysis was rightfully lauded as an innovative new way to think about withdrawal rates in retirement, I don’t think even he meant for the 4% figure to serve as a hard and fast rule for every retiree, under every assumption, throughout their entire retirement (during which your lifestyle is likely to evolve).

The same goes for the 70% rule, and similar retirement rules.

Financial Talking Heads’ Rants on Retirement withdrawal Rate and other Shenanigans

In lieu of rules of thumb, people are also known to follow the shotgun advice of popular financial gurus who spout sweeping generalities as perfect solutions for one and all.

A prime example is Dave Ramsey of The Ramsey Show, who recently assured listeners that an 8% retirement withdrawal rate should “last forever,” as long as you invest as he suggests. He said a 4% spending rate was “asinine,” based on calculations generated by “super nerds,”“goobers,” and “morons who live in their mother’s basement with a calculator.” He then goes on a Wizard of Oz tirade about flying monkeys stealing your ruby slippers. Seriously, you can’t make this stuff up. (Check out 01:19:20 in The Ramsey Show’s “You Can’t Win with Money if You Don’t Know Where Your Money Is”  podcast episode.)

Ramsey’s math is simple, which makes it appealing and easy to understand: “If you’re making 12 [percent] in good mutual funds and the S&P is averaging 11.8, and if inflation for the last 80 years is 4%, if you make 12 and you need to leave 4% in there for average inflation raises, that leaves you eight. So, I’m perfectly comfortable drawing eight. But if you want to be a little bit conservative, seven. But, sure, not five or three.”

In a Rational Reminder rebuttal episode, “Retiring Retirement Income Myths with the Retirement Income Dream Team,” my super-nerd friends (David Blanchett, the Managing Director and Head of Retirement Research for PGIM DC Solutions; Michael Finke, a distinguished professor of wealth management at the American College of Financial Services; and Wade Pfau, Director of Retirement Research at McLean Asset Management) offer what I believe is a considerably more realistic assessment of the market’s risks and expected rewards over time, with no monkey business involved:

Without going too heavily into the math, the two main counter arguments against an 8% withdrawal rate from the Retirement Income Dream Team are:

  • There can be large differences between geometric returns (what you earn in an investment) and arithmetic returns (the simple average). For example, an average 12% return doesn’t mean that a retiree’s portfolio grows by 12% per year. If $1 million invested in stocks falls by 20%, you now have $800,000. If it rises by 25% the next year, you’re back up to $1 million. The average return of -20% and positive 25% is 2.5%. But you still only have a million bucks. Your actual return was zero.
  • A 100% stock portfolio significantly increases the sequence of returns risk. For example, a U.S.-based investor, owning U.S. stocks in the 2000s and following an 8% withdrawal rule would have run out of money in as little as 13 years.
Source:  https://www.thinkadvisor.com/2023/11/13/supernerds-unite-against-dave-ramseys-8-safe-withdrawal-rate-guidance/

I would add from a behaviour side of things, that a 100% stock portfolio, especially during retirement would be virtually impossible to stick with.

When it comes to Retirement Savings, One Size rarely fits all

Besides, don’t you want your retirement numbers to be based on personalized levels of evidence and reason, instead of hope and hype? I know I do, which is why I treat sweeping assumptions and general rules of thumb as starting rather than ending points.

By necessity, generic advice involves making assumptions, often huge ones, that may or may not reflect your own realities. The original 4% Rule, for example, assumed the investor is investing their retirement nest egg in 50% stocks/50% bonds, held entirely in tax-sheltered accounts. It also assumed a 30-year retirement.

Not everyone wants or needs to invest this conservatively. At the other end of the spectrum, Ramsey appears to assume you’re going to put your entire nest egg in the U.S. stock market, mostly large-company growth. He also seems to assume (quite erroneously) that we can rely on this market to deliver an average 12% pre-inflation return forever.

My take: There’s nothing nerdy about wanting to avoid hoarding or squandering your wealth. If your retirement years are short enough, your income remains ample enough, and your market timing is lucky enough, spending 8% annually in retirement might be right for you. For others, even 4% is overly optimistic. Either way, I wouldn’t bank on any given number without first engaging in some serious reality checks, and revisiting your plans as you proceed.

Let’s return to our fictional investors to illustrate how real-life retirement planning, withdrawal rate, and spending works. Continue Reading…