Special to the Financial Independence Hub
LendEDU’s fourth annual lottery spending report analyzed the most recent U.S. Census data to see what the average American is spending on the lottery, which states spend the most, and how each state spends its yearly lottery revenue.
In the United States, the lottery offers one of the quickest routes to the American Dream; for just a few dollars, you could become a multi-millionaire in a matter of minutes.
Yet, the odds of that happening are incredibly slim, and the money spent on lottery tickets can quickly become substantial.
For the last three years, LendEDU has analyzed U.S. Census Bureau data on annual lottery spending by state to find how much the average American spends, in addition to each state’s lottery expenditure per capita.
Our fourth annual lottery spending report brings you those same statistics and some new ones. This year, we also broke down how each state spends its annual lottery revenue and what each state’s lottery expenditure per capita is as a percentage of its median household income.
Average Lottery Spending by Americans Hits Recent High
 The U.S. Census Bureau releases its lottery spending data on a two-year lag, so the data that was released on January 31, 2020 reflects lottery spending data from 2018.
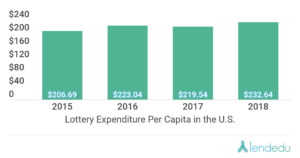
Since LendEDU started doing this report, lottery spending per capita in the U.S. hit a recent high in 2018.
In 2018, Americans spent a combined $76,362,627,000 on the lottery, while the most recent U.S. population estimate from the Census is 328,239,523.
This puts the lottery expenditure per capita in the U.S. at $232.64, which is up $13.10 compared to 2017’s figure.
Massachusetts spends the most on the Lottery
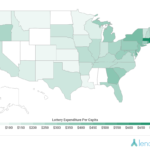
By taking each state’s total lottery expenditure from 2018 and dividing it by the most recent population estimate, we put together a map that breaks down state lottery spending per capita.
And once again, lottery players from Massachusetts spent the most on the lottery in 2018, $765.90. This figure is up from the state’s number from last year, $737.01. In comparison, North Dakota once again had the lowest expenditure per capita, going from $34.68 in 2017 to $30.32 in 2018.
For reference, six states do not offer a lottery: Alabama, Alaska, Hawaii, Mississippi, Nevada, and Utah. Washington D.C. does offer a lottery but does not report any official figures to the U.S. Census Bureau, therefore they have been excluded from this report.
State-by-State Lottery Expenditure Per Capita From 2016 to 2018
Below, you will see how each state’s lottery expenditure per capita has changed from 2016 to 2018 according to each state’s lottery revenue and population from each year.
Measuring each State’s 2018 Lottery Expenditure per capita against median household pncome
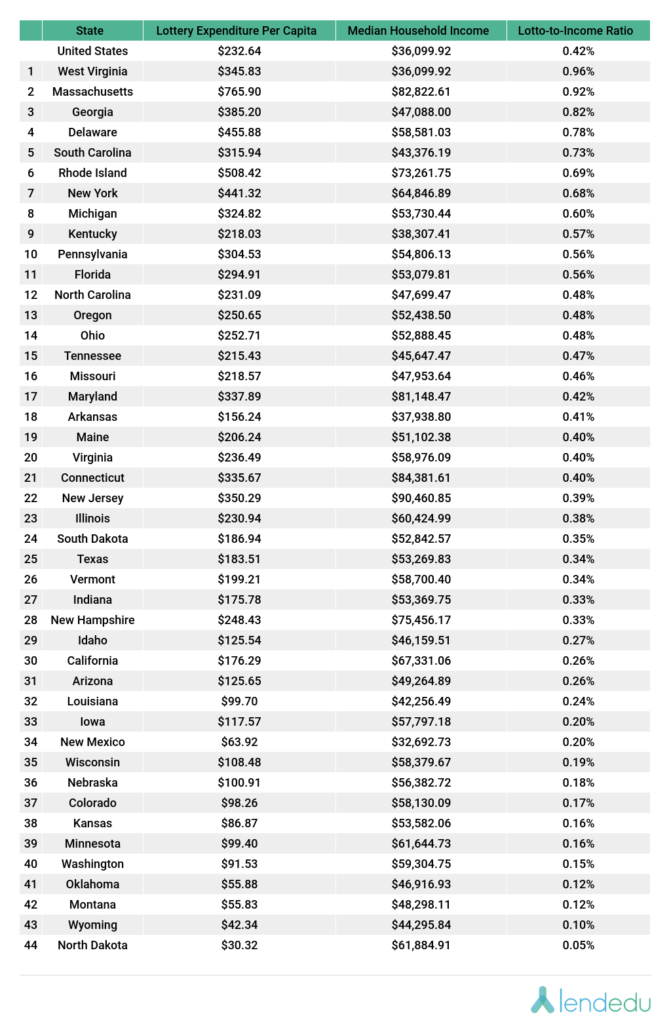
Next, we measured each state’s 2018 lottery expenditure per capita against its median household income to see how much money is being spent on lottery tickets each year relative to what people make in a given state.
In 2018, West Virginia spent 0.96% of its median household income on lottery tickets, the highest percentage in the country. Conversely, North Dakota spent 0.05% of its median household income on lottery tickets, the lowest in the nation.
State-by-State annual Lottery Revenue from 2016 to 2018
For many states, the lottery is a massive generator of revenue each year with 20 states making over $1 billion on the lottery in 2018. Collectively, the U.S. brought in $76,362,627,000 on the lottery in 2018, which was up from $71,826,684,000 in 2017.
On a state-by-state level, New York brought in the most lottery revenue in 2018: $8,585,199,000. And on the other end, North Dakota brought in the least lottery revenue in 2018: $23,103,000.
How each State spends its Lottery revenue
Included in the U.S. Census Bureau lottery dataset is a breakdown of how each state spent its lottery revenue in 2018. For the U.S. as a whole, 64.56% of 2018’s lottery revenue was used for prizes, 30.92% was earmarked as “proceeds available,” and 4.51% was used for administrative costs.
There was a wide-discrepancy in how states administered their respective lottery revenue. For example, Idaho used 78.53% of its lottery revenue for prizes, while West Virginia only used 16.97%.
Methodology
All lottery data found within this report was pulled from the U.S. Census Bureau. We used the data from the 2018 Annual Survey of State Government Finance Tables, which was last revised on January 31, 2020. Specifically, we used the data found within the “Income and Apportionment of State-Administered Lottery Funds: 2018” label. This data provided the revenues generated from the lottery in 2018 and also included how the lottery revenue was disbursed in each state. Due to 2019’s data not being released until 2021, this is the most recent lottery data available.
The second data source used was the U.S. Census Bureau’s State Population Totals and Components of Change: 2010 – 2019, which was used to find the population figures for each state and the entire country. Specifically, we used the data found within the “Annual Estimates of the Resident Population Change for the United States, Regions, States, and Puerto Rico: April 1, 2010 to July 1, 2019” label. This is the most up-to-date population data from the U.S. Census Bureau and was last revised on December 30, 2019. Each state’s lottery revenue was divided by the same’s state’s population for 2019 to find the yearly lottery expenditure per capita. Lottery expenditure per capita figures from the previous year were carried over from previous reports by LendEDU.
The third and final source used was GreatData, whose dataset is licensed by LendEDU. GreatData’s data derives mainly from the U.S. Census Bureau, but GreatData also calculates and combines its own projections based on historical trends to provide the most up-to-date data. GreatData’s data was used to find the median household income for each state and the country as a whole. Each state’s lottery expenditure per capita was divided by its median household income to find the lotto-to-income ratio.
 In his role at LendEDU, Mike uses data, usually from surveys and publicly-available resources, to identify emerging personal finance trends and tell unique stories. Mike’s work, featured in major outlets like The Wall Street Journal and The Washington Post, provides consumers with a personal finance measuring stick and can help them make informed finance decisions. This blog first appeared on the LendEDU web site on July 21, 2020 and is republished on the Hub with permission.


