Special to the Financial Independence Hub
Once upon a time there was a man who loved apples so much that he wanted to own an apple tree. So, he went to an apple-tree broker to buy one. The man was impressed to see an apple tree one hundred feet tall with apples the size of basketballs. He asked how much it would cost to buy such a magnificent tree.
The apple-tree broker smiled tolerantly and said, “No one person can own such a magnificent tree. You can only own one tiny piece of it, a small branch a few inches long. How much do you have to invest?”
The man replied that he would like to own more than one tiny branch. Surely there must be something in your orchard that I can buy?”
The apple-tree broker said of course there is, but you must understand that for twenty years the apples that come from this magnificent tree have got increasingly bigger and even more plentiful. Even these little twigs, in time, will produce several more giant apples than they do now.
“What else do you have?”
“Well over in this corner are 10 trees you could buy for the same amount of money; however, some years they do not produce apples and the apples are very small but if you really want a bargain, I can give you 100 apple trees for one dollar. Hold out your hand.”
The apple broker poured one hundred apple seeds into the man’s palm who testily responded, “These aren’t magnificent apple trees?”
“No, these are speculative apple trees. You are buying them for their potential.”
“What else do you have?”
“Well, see those fellows over there. They operate apple tree funds. They buy 500 apple trees at a time and sell people like you a piece of their apple tree fund.”
“Are these 500 apple trees all magnificent trees?”
“No. Of course not. There are fewer than 100 magnificent trees available to buy. The fund may have partial ownership of a dozen magnificent trees but for diversification they spread the risk of apple trees over five hundred trees. They call it their safe apple tree index.”
”Would this include some that are just seeds, some a few inches high, some a few feet higher and some fully grown ones whose production of apples may be spotty from year to year?
“It would but some might grow into magnificent trees, and you might be able to sell units in the fund for more than you paid.”
Safer to invest in 20 dividend-paying stocks than funds
This allegory is an attempt to explain why you are safer investing in 20 financially strong companies paying high dividends then investing in index funds, mutual funds, and ETFs. Why would you invest in hundreds of weak, mediocre stocks when you could invest the same amount of money in financially strong companies paying high dividends? Strong companies with easily accessible historical records that can show their share price and dividend payments increasing yearly for decades.
These are companies that have paid dividends every month or quarter through the market crashes that come around about every four years.
Hundreds of financially strong companies paying high dividends do not exist. Thus, when you see a mutual fund, ETF, or Index fund with hundreds of stocks in it would you expect that the vast majority of stocks in the fund are weak and mediocre? So why do investors put their money into funds holding five hundred stocks or more? Why do they think it is a positive thing to have so many stocks in a fund?
My belief is that most investors have no idea how easy it is to sort hundreds of stocks from most to least desirable by their strength and dividend payout. Investors think their investment advisor and fund managers can always predict which share in a fund will increase. Unfortunately, they can’t. The fund managers’ concern is to at least match the index percents.
Matching the index allows the fund manager to keep their job. With this objective in mind, they load their funds with hundreds of stocks to mimic the index and minimize the chance that their fund could do worse than that index. When you look at the makeup of such funds you will see a few stocks that will make up 1% of the fund but most of the shares are only a fraction of 1%. Sometimes the fund manager gets lucky, and the rare fund performs better than the index with little likelihood of repeating it next year.
 What happens when you show investors a simple, straightforward way to score stocks so they can sort financially strong stocks who pay high dividends from, most to least desirable? They end up with an easily manageable portfolio of 20 of the very best stocks that they invest equally in.
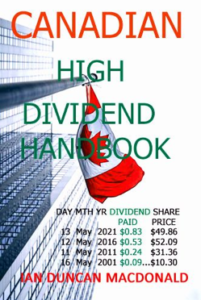
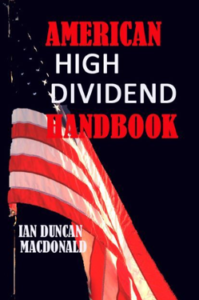
My two latest investment books, “American High Dividend Handbook” and “Canadian High Dividend Handbook” walks investors through the process of selecting the best, safest, most rewarding dividend stocks for their portfolio.
They begin their selection by scanning charts like the following, which are sorted by stock score, share price, dividend yield percent and alphabetically ( alphabetical like the following extraction from the Canadian alphabetical sort)
…..SCORE…….STOCK………………….PRICE $……………… DIVIDEND %
2021..(2020)..(2019)..SYMBOL..COMPANY….2021…(2020)…(2019)…..2021..(2020)..(2019)
E
12..(9)..(new)..ENS……E Split Corp………. $13.15…(11.88)…(14.75)…..%11.86…(13.00)..(10.00)
36..(20)..(28)..ELC……Elysee Development..$0.73…(0.34)…..(0.38)……..%8.22…12.00)…(11.00)
66..(62)..(65)..EMA…..Emera Inc………………$56.34..(56.20)..(50.31)….%4.53…(4.36)…(4.70)
70..(70)..(60)..ENB……Enbridge Inc………..$47.20…(40.70)…(49.40)….%7.08…(7.96)…(6.00)…
34..(39)..(26)..ENI.UN..Energy Income………..$1.51…..(1.20)….(1.82)…%7.95…(10.00)..(6.60).
The next step is to take their chosen stocks and go to each stock’s page in the handbooks to realize a more detailed understanding of the stock’s financial strength and its last twenty years of evolution (like this example for Enbridge (ENB). You can see how each of eleven sub-scores add up to the total score/
Date: 15 MAY 2021
Company Name: Enbridge Inc
Stock Symbol: ENB
Today’s Stock Price $47.20 Score = 8
Price 4 Years Ago $52.00 Score = 9
Current to Historical Price Comparison Score = 5
Stock’s Book Value $30.29 Score = 8
Book Price to Book Value Comparison Score = 0
Analysts Buy Ratings # 9 Score = 5
Analyst Strong Buy Ratings # 1 Score = 3
Dividend Yield % 7.08 Score = 8
Stock’s Operating Margin % 21.34 Score = 5
Daily Shares Traded # 16,508,203 Score = 10
Price to Earnings Ratio 15.1x Score = 9
Total Score = 70
HISTORICAL STOCK PRICES & DIVIDEND PAYOUTS
Month Day Year Dividend $ Stock Price $
May 13 2021 $0.83 $49.86
May 12 2016 $0.53 $52.09
May 11 2011 $0.24 $31.36
May 16 2001 $0.09 $10.30
Just before they purchase their choice, they rescore the stock with the free IDM stock scoring software that is emailed to book buyers who request it. These careful investors enter the 9 freely available facts into the windows. (The software has worked on all devices).
A perfect score would be an impossible 100. The highest score I have ever seen is 82. The lowest is 8. Most investors seek stocks scoring over 50. The harsh reality is that those stocks with the highest scores often have dividend yields below 5% and those stocks paying the highest dividend yields often score below 50. It takes a little judgment to arrive at the very “best” 20 stocks for your portfolio. Your objective is realizing an average dividend yield, for your total portfolio, no lower than 6% and an average annual capital gain exceeding 9%.
Such results are important for those who these investment books are written:
– those who have never invested
. – those who have lost money in the stock market
. – those who fear outliving their life savings.
– those who fear the next stock market crash.
 The American High Dividend Handbook provides investors with useful charts covering all 286 common stocks traded on the New York Stock Exchange and the NASDAQ paying dividends of 3.5% or more. It’s companion book, the Canadian High Dividend Handbook covers all 186 common stocks paying dividends of 3.5% traded on the Toronto Stock Exchange. Both books are available as e-books and print books from Amazon/Kindle.
In the next stock market crash you will not panic because you will know that despite all share prices dropping that the dividends of your carefully chosen high dividend stocks have always paid their dividends through market crashes and their share prices have always recovered and achieved new record highs. You will live on your regular dividend payments until the inevitable recovery. Unlike the weak strategy of buy low-sell-high speculative investing, a portfolio of financially strong companies paying high dividends, never stops growing because it has three verifiable revenue flows:
(1) The regular monthly or quarterly dividend payouts
(2) The ever-increasing dividend amounts being paid out .
(3) The ever-increasing share prices.
Speculators seem unable to accept that no one can accurately predict future share prices. Fortunately, speculators only control share prices, they do not control a company’s profits. The executives of a company control profits and profits are predictable. DIVIDENDS ARE PAID FROM PROFITS!
 After graduating from McMaster University, with $100 left in his pocket (but no student debt), Ian Duncan MacDonald hitch hiked home to Sudbury to work four months as a labourer in International Nickel’s smelter. In four months, he had saved enough to seek his fortune in the big city.
In Toronto, he was immediately hired by Dun & Bradstreet as a credit reporter. While he had expected to be a reporter for the rest of his life, D&B had other plans. Within four years, he was General Manager of their Marketing Services Division. Three years later, at the age of 28, he was responsible for the sales, marketing and advertising for all three divisions of the company.
At 32, he left D&B to build Screening Systems International Ltd, for a large conglomerate, which led to his interest in collections. Moving to Creditel of Canada Ltd. he became Senior Vice President. Subsequently bought by Equifax, he remained there until his retirement in 2005. In anticipation of his retirement he incorporated Informus
Inc. to sell his art, his publications and consulting services (www.informus.ca.)
For more information on Ian’s 7 books, videos, podcasts and more go to www.saferbetterdividendinvesting.com


