“Where there are no expectations, there is no disappointment.”
- Charles Krauthammer

By Noah Solomon
Special to Financial Independence Hub
Although April’s slide in risk assets was by no means disastrous, it was uninspiring to say the least. Almost every single bourse suffered losses, with the notable exception of Chinese equities. In this month’s missive, I will discuss both the “setup” behind April’s market volatility as well as the catalysts which triggered it.
Greed is Good, Except When it’s Not
In the 1987 film Wall Street, Michael Douglas portrays Gordon Gekko, a Wall Street tycoon who is utterly devoid of morals. In 2003, the American Film Institute named Gekko number 24 on its top 50 movie villains of all time. Gekko’s classic line, “Greed, for lack of a better word, is good,” is perhaps one of the most iconic lines in the history of cinema.
Notwithstanding that greed is generally frowned upon (Gekko was, after all, a villain) there are times in markets when greed should be encouraged. When investors suffer severe losses during bear markets, there is little appetite for risk and sparse demand for stocks. At such junctures, equities become “washed out” and valuations reach levels where the risk of owning stocks is below average and their prospective returns are above average.
In contrast, there are times when greed, and its close relative, FOMO (fear of missing out) can have painful consequences. When stocks have experienced a largely uninterrupted string of above average returns, greed tends to be in abundance, while its counterpart, fear, is nowhere to be seen. Such lopsided sentiment pushes up valuations to the point where stocks offer little (or negative) return and pose elevated risk. Putting fresh money to work in such environments is akin to picking up pennies in front of a steam roller.
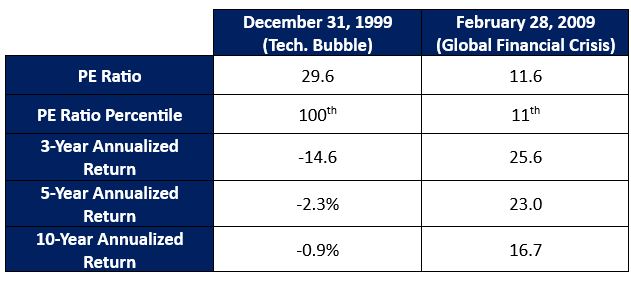
S&P 500 Index: Performance Following Valuation Extremes
By the end of 1999, euphoric sentiment had pushed the S&P 500 to nearly 30 times forward earnings, which marks its highest valuation over the past 30 years and set the stage for a “lost decade” for investors. At the other end of the spectrum, the global financial crisis caused investors to sour on stocks to the point where the S&P 500 Index was valued at less than 12 times forward earnings, which placed it in the bottom 1% of its valuation range over the past 30 years. From this starting point, U.S. stocks subsequently rose at a breakneck pace.
Since time immemorial, one of the constants in markets is that human behavior and emotions lead to unsustainable conditions. Losses tend to follow extremes of confidence, while outsized gains tend to follow extremes of despondency. Buffett best summarized this cycle in his statement, “Be fearful when others are greedy and greedy when others are fearful.”
What can go Wrong? Nothing and Everything … Depending on your Expectations
As 2023 was drawing to a close, the prevailing narrative was that:
- The U.S. economy would avoid a recession and expand at a healthy clip.
- Inflation would continue its downward trajectory, which would allow the Fed to enact six quarter-point rate cuts over the course of the following year.
Short of a future which entailed solid economic growth coupled with a return to zero interest rates, investors could not have hoped for a better environment than the one which was anticipated for 2024.
We acknowledge that there were good reasons for this optimism, including the recent decline in inflation and a surprisingly resilient economy. However, these sentiments were fully reflected (and perhaps over-reflected) in asset prices.
Whether things go right or wrong per se is not what moves markets. At least as important is what is embedded in asset prices at the time when things go right or wrong. At the beginning of 2024, valuations were discounting a scenario in which pretty much everything would go the “right way” for equities. As such, when April’s inflation readings failed to register the anticipated improvement, stocks had an adverse reaction. Had markets (and by extension valuations) been less optimistic prior to this negative surprise, it is likely that April’s decline in prices would have either been less severe or nonexistent.
Goldilocks has left the Building: from Tailwinds to Headwinds
Between 2008 and 2020, inflation remained extremely well-behaved, often running below 2%. This gave the Fed little reason to tighten monetary policy, especially since markets tended to react adversely to any sign of rising rates. Central bankers were in the enviable position of having their cake and eating it too. They left rates at record low levels for an extended period and stimulated economic growth while simultaneously keeping the inflation genie safely contained in its bottle. This fostered a near-perfect backdrop for strong gains in asset prices.
Perhaps the single most important factor that enabled this Goldilocks environment was a dramatic increase in international trade and global integration. From the 1990s through mid-2016, total international trade rose from roughly 39% to 56% of global GDP, propelled largely by the consistently rapid growth of the Chinese economy. According to the National Bureau of Economic Research, this surge in trade led to an annualized reduction in U.S. inflation of between 0.1% and 0.4% between 1997 and 2018.
This strong tailwind of globalization has stalled, as anti-trade rhetoric has become increasingly prevalent. Populism and economic protectionism have intensified around the globe, most notably between the U.S. and China. The likelihood of greater global economic integration for the foreseeable future has also been reduced by a rash of geopolitical conflicts, which have caused companies to reevaluate supply chains and explore nearshoring opportunities.
While these developments do not mean that rates cannot decline from current levels, they do suggest that the neutral setting for monetary policy (i.e. the rate which is neither inflationary nor restrictive) may be higher than what markets have grown accustomed to. Alternately stated, non-inflationary trend growth may be lower than has been the case over the past couple of decades. Barring a true catastrophe, I suspect that the world will have to tolerate some combination of higher rates, higher inflation, and lower growth. Goldilocks has left the building and she ain’t coming back anytime soon. This distinct possibility carries significant implications for markets and portfolio positioning.
The Road Ahead: The Starting Point Matters
As previously mentioned, it is not just what happens, but what happens relative to what markets are discounting when it happens. From this perspective, U.S. equities are not priced for a higher-rate, lower-growth world.
As of the end of April, the P/E ratio of the S&P 500 Index stood at nearly 21 times forward earnings, placing it in the 88th percentile of its valuation range over the past 20 years. This level is particularly ominous when one adjusts for the recent spike in rates. The difference between the index’s forward earnings yield of 4.80% and the 4.50% yield on 10-year Treasuries is a paltry 0.30%, which is the narrowest spread since the dotcom bubble of the late 1990s. Although this by no means assures that U.S. stocks are ripe for a bear market, it strongly suggests that returns will be below average over the medium-term.
In contrast, at 15.2 times forward earnings the current P/E ratio of the TSX Composite stands in the 38th percentile of its valuation range over the past 20 years. On a relative basis Canadian stocks look like even more of a bargain, with the relative multiple of the TSX Composite vs. the S&P 500 in the bottom 10th percentile of the range over the past 20 years.
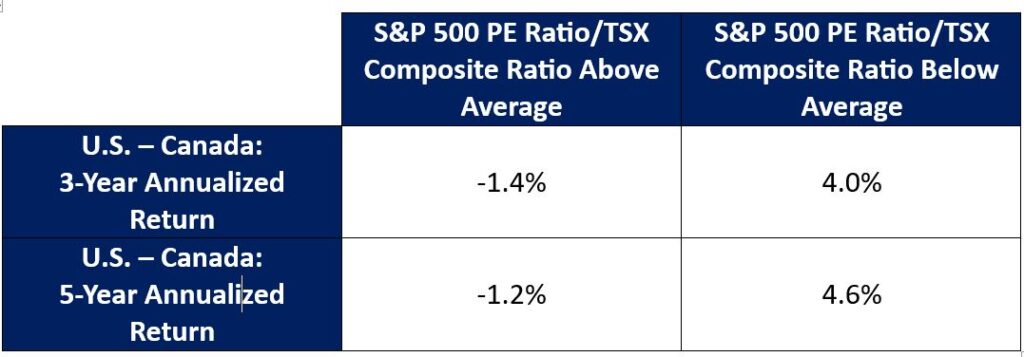
Importantly, the valuation spread between U.S. and Canadian stocks has historically been a reasonable harbinger of the relative performance of the two markets. As the following table demonstrates, when the relative valuation of U.S. vs. Canadian stocks has been above average, the latter have tended to outperform, and vice-versa.
Performance of Canadian vs. U.S. Equities Based on Relative Valuations (2003-2023)
From a style perspective, investors would be well served to tilt their equity exposure in favor of value stocks, which are less dependent on low rates and high economic growth than their growth counterparts. From a geographical perspective, it would also be prudent to increase allocations to Canadian vs. U.S. stocks given that the latter are poised to reverse their decade-long run of outperformance.
 Noah Solomon is Chief Investment Officer for Outcome Metric Asset Management Limited Partnership. From 2008 to 2016, Noah was CEO and CIO of GenFund Management Inc. (formerly Genuity Fund Management), where he designed and managed data-driven, statistically-based equity funds.
Between 2002 and 2008, Noah was a proprietary trader in the equities division of Goldman Sachs, where he deployed the firm’s capital in several quantitatively-driven investment strategies. Prior to joining Goldman, Noah worked at Citibank and Lehman Brothers. Noah holds an MBA from the Wharton School of Business at the University of Pennsylvania, where he graduated as a Palmer Scholar (top 5% of graduating class). He also holds a BA from McGill University (magna cum laude).
Noah is frequently featured in the media including a regular column in the Financial Post and appearances on BNN. This blog originally appeared in the April 2024 issue of the Outcome newsletter and is republished here with permission.


