
By Ariel Liang, BMO Global Asset Management
(Sponsor Blog)
If you’ve ever felt nervous about the stock market ups and downs, you’re not alone. Most investors want their money to grow steadily without the wild swings: especially if you’re thinking about retirement. Lately, worries about an AI bubble and changing interest rates have shown just how quickly things can get unpredictable.
That’s why building the right portfolio is important to help you stay calm and stay invested, even when markets get a little rocky.
Low-volatility investing, and specifically using funds such as BMO Low Volatility Canadian Equity ETF (ZLB) and BMO Low Volatility US Equity ETF (ZLU), are designed to give you a smoother experience. These strategies help you stay invested with confidence no matter what the markets are doing.
What does Low Volatility mean for your Investments?
Imagine low-volatility investing as playing it smart in baseball: not trying for risky home runs, but focusing on steady singles and doubles. This way, you keep making progress, scoring runs over time, and avoiding big losses. It’s all about reliable growth, not wild swings that could set you back.
ZLB and ZLU are designed to help your investments stay on track, even when markets get unpredictable. They pick companies that don’t jump around as much as the overall market: think of them as the steady players on the team. By steering clear of those big ups and downs, your money can grow more smoothly, and you can benefit from compounding over time.
Building a Smoother Ride with Low volatility
ZLB and ZLU focus on defensive sectors like utilities, consumer staples, and healthcare. These ETFs can act as financial shock absorbers, reducing risk from market swings and limiting exposure to more volatile sectors like technology. Position and sector caps further protect against over-concentration, while the selection of low-beta1 companies means the portfolio is designed to cushion losses during downturns.
The disciplined construction of ZLB and ZLU helps you stay on course regardless of market conditions. This approach isn’t about chasing the latest trends but about building steady, long-term growth through stability and diversification, letting compounding work its magic over time.
Low volatility cushioned the blow with stability
Chart 1
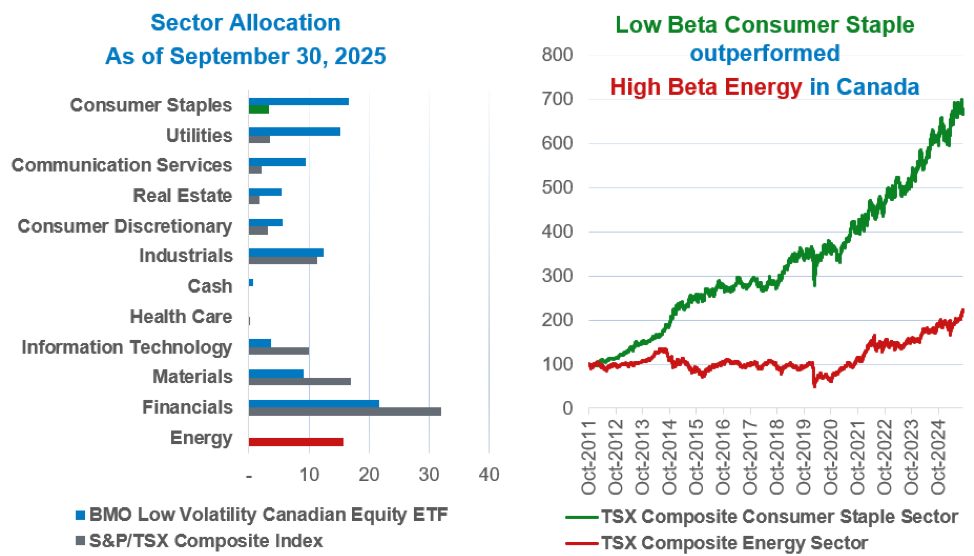
Note: Data as of September 30, 2025. Source: BMO AM Inc. Bloomberg Sector allocation subject to change without notice. Chart compares sector allocations of BMO Low Volatility Canadian Equity ETF and S&P/TSX Composite Index as of September 30, 2025, and shows Consumer Staples outperforming Energy in Canada from 2011 to 2024.
Common Myth: Low-Volatility ETFs reduce Return
Low volatility doesn’t mean you have to settle for lower returns. In fact, Canadian low-volatility investments have consistently outpaced the S&P/TSX Capped Composite Index since inception, offering strong returns while helping to reduce risk.
Chart 2
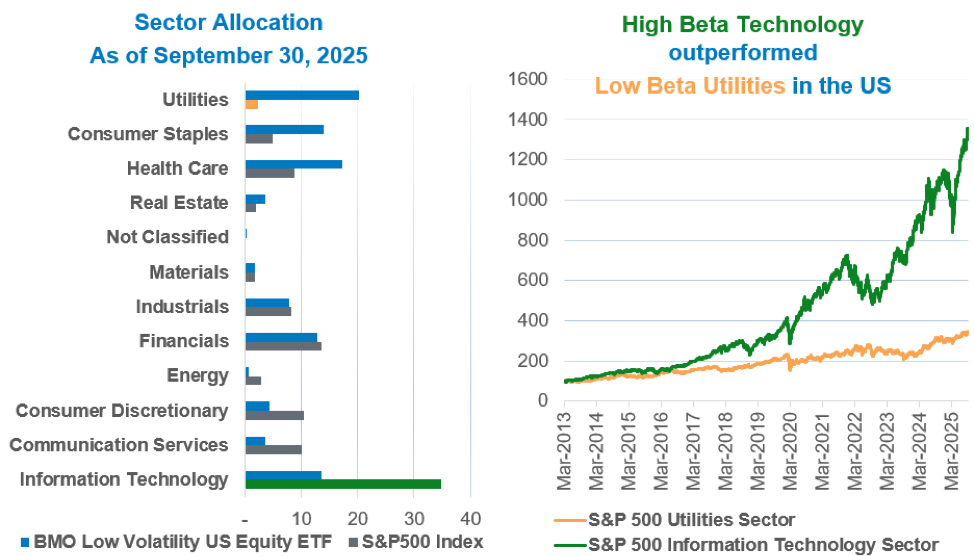
Note: Data as of September 30, 2025. Source: BMO AM Inc. Bloomberg Sector allocation subject to change without notice. Chart compares sector allocations of BMO Low Volatility US Equity ETF and S&P 500 Index as of September 30, 2025, and shows Technology outperforming Utilities from 2013 to 2025.
The U.S. market is highly concentrated in the Magnificent 72 and generally information. Because ZLU invests more in stable sectors like utilities and healthcare, it provides steady, long-term returns, though it might not keep up with the S&P 500 when the market is booming, as it has more recently with the growth dominated in the Tech sector. Even with this more cautious approach, ZLU still delivers strong annual returns for investors by emphasizing stability and value rather than jumping into the latest tech trends.
Balanced Growth, Less Stress: Blending ETFs for Smoother Returns
If you want steady growth for your portfolio without taking on too much risk, you may not have to choose between safety and strong returns. By combining BMO Low Volatility US Equity ETF (ZLU) with BMO NASDAQ 100 Equity Index ETF (ZNQ), you can get the best of both worlds: reliable stability and exciting growth. This mix has delivered higher returns and lower risk than simply investing in BMO S&P 500 Index ETF ( ZSP) as shown in Chart 3.
So what does this mean for you? It means your investments may grow faster and experience fewer ups and downs, helping you stay confident no matter what the market does.
Chart 3: Annual Returns: Blended North American Low Volatility Portfolios (2015–2024)
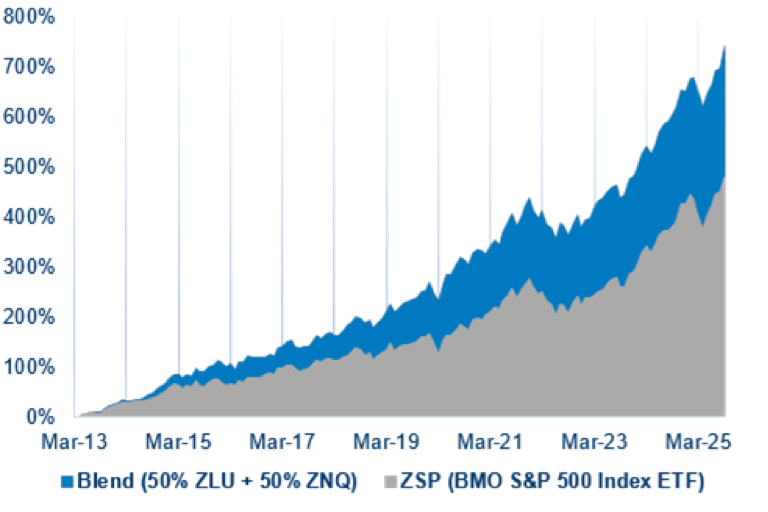
Source: BMO AM Inc. Bloomberg as of September 30, 2025. Blend of 50% ZLU and 50% ZNQ outperformed ZSP in cumulative returns from 2013 to 2025.
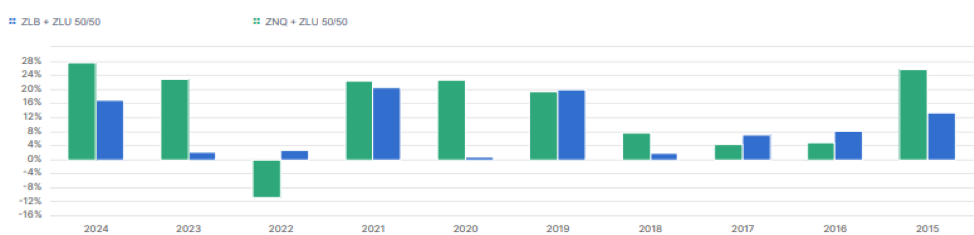
Last, if we look at blending ZLU with ZLB at a 50/50 split, the North American portfolio has not had a single down year since 2013. While past performance can’t guarantee future results, this track record shows how consistent and resilient these strategies have been.
In short, by blending these ETFs, you’re giving yourself a smoother investment journey with less drama and more peace of mind. This way you can stay invested, stay confident, and let your portfolio do the work for you.
| Since Inception | Total Return | Total Risk | Sharpe Ratio3 |
| Blend (50% ZLU + 50% ZNQ) | 18.59% | 11.44% | 1.62 |
| ZSP | 16.83% | 12.08% | 1.39 |
| Delta | +1.76% | -0.64% | 0.23 |
Chart 4: Annual Returns Comparison: ZLB+ZLU vs. ZNQ+ZLU (2015–2024)
 Source: BMO AM
Bar chart comparing annual returns from 2015 to 2024 for two ETF portfolios (ZLB+ZLU 50/50 in blue and ZNQ+ZLU 50/50 in green), showing varying positive and negative performance across years.
BMO Global Asset Management’s (GAM) Approach
Imagine flying in a modern airplane: computers handle most of the work, but the pilot is always ready to step in for takeoff, landing, or when things get turbulent. At BMO GAM, our investment approach works the same way. Our advanced quantitative models act as your co-pilot, guiding decisions and reducing human error, while the portfolio manager — the pilot — monitors everything and steps in to keep your investment journey smooth.
When you invest with BMO GAM, you can relax and let our team navigate the ups and downs of the market for you. For example, on “Liberation Day” (April 2, 2025), when the TSX dropped 3.84% in a single day due to tariff threats, the BMO Low Volatility Canadian Equity strategy held steady, outperforming the TSX by 3.45% on that day alone. Even during challenging years like 2022, our BMO Low Volatility U.S. Equity strategy posted a gain of 5%, while both stocks and bonds fell. That’s what we mean by a smoother ride.
Win by Not Losing
Instead of chasing home runs, focus on steady, consistent gains: like hitting singles and doubles. Low-volatility ETFs such as ZLB and ZLU are designed to reduce sharp losses and keep you invested through market ups and downs.
In today’s uncertain environment, staying invested while managing risk is key. These ETFs help you navigate volatility with confidence, making low-volatility a smart, long-term strategy.
Stay in the game—explore ZLB and ZLU today
1 Beta: a measure of the volatility of a security compared to the market as a whole.
2 Mag 7: a group of seven high-performing and influential stocks in the technology sector.
3 Sharpe Ratio measures how much return you get for each unit of risk. A higher number means a better risk-adjusted return.
| Ticker | Annualized Performance
YTD |
1Y | 2Y | 3Y | 5Y | 10Y | Since Inception |
| BMO Low Volatility Canadian Equity ETF(ZLB) | 25.15% | 21.79% | 22.47% | 15.58% | 13.88% | 11.06% | 12.86% |
| BMO Low Volatility US Equity ETF(ZLU). | 10.16% | 6.17% | 15.40% | 8.34% | 10.80% | 10.17% | 13.59% |
| BMO NASDAQ-100 Equity Index (ZNQ) | 17.92% | 21.58% | 28.50% | 30.39% | 17.74% | — | 22.22% |
| BMO S&P 500 Index ETF(ZSP) | 14.26% | 14.48% | 25.56% | 21.72% | 16.61% | 14.74% | 17.81% |
 Ariel Liang, CFA, MS, LLM, is Director, Portfolio Manager, Quantitative Investments for BMO Global Asset Management. Ariel joined BMO in January 2018, focusing on investment management and research across Canada, the US and Global markets. Since 2005, she has dedicated her career to systematically applying fundamental insights in investing. Before BMO, Ariel served as a quantitative researcher at RBC Global Asset Management, designing and enhancing their flagship QUBE funds and ETFs. Additionally, she has held roles as an Associate Portfolio Manager for the Canada Pension Plan Investment Board and as an Investment Analyst for the Ontario Teachers’ Pension Plan. Ariel holds a Master of Mathematical Finance and a Global Professional Master of Laws from the University of Toronto, a Master of Economics from Simon Fraser University, and a Bachelor of Finance from Nankai University. She is also a CFA charterholder and a member of the CFA Society of Toronto.
DISCLAIMERS
Any statement that necessarily depends on future events may be a forward-looking statement. Forward-looking statements are not guarantees of performance. They involve risks, uncertainties and assumptions. Although such statements are based on assumptions that are believed to be reasonable, there can be no assurance that actual results will not differ materially from expectations. Investors are cautioned not to rely unduly on any forward-looking statements. In connection with any forward-looking statements, investors should carefully consider the areas of risk described in the most recent prospectus.

Past Performance is not indicative of future results.

The viewpoints expressed by the author represent their assessment of the markets at the time of publication. Those views are subject to change without notice at any time. The information provided herein does not constitute a solicitation of an offer to buy, or an offer to sell securities nor should the information be relied upon as investment advice. Past performance is no guarantee of future results. This communication is intended for informational purposes only.

All investments involve risk. The value of an exchange-traded fund (ETF) can go down as well as up and you could lose money. The risk of an ETF is rated based on the volatility of the ETF’s returns using the standardized risk classification methodology mandated by the Canadian Securities Administrators. Historical volatility doesn’t tell you how volatile an ETF will be in the future. An ETF with a risk rating of “low” can still lose money. For more information about the risk rating and specific risks that can affect an ETF’s returns, see the BMO ETFs’ prospectus.

This communication is for information purposes only. The information contained herein is not, and should not be construed as investment, tax or legal advice to any party. Particular investments and/or trading strategies should be evaluated and professional advice should be obtained with respect to any circumstance.

Nasdaq® is a registered trademark of Nasdaq, Inc. (which with its affiliates is referred to as the “Corporations”) and is licensed for use by the Manager. The ETF has not been passed on by the Corporations as to their legality or suitability. The ETF is not issued, endorsed, sold, or promoted by the Corporations.  The Corporations make no warranties and bear no liability with respect to the ETF.

The Index is a product of S&P Dow Jones Indices LLC or its affiliates (“SPDJI”), and has been licensed for use by the Manager. S&P®, S&P 500®, US 500, The 500, iBoxx®, iTraxx® and CDX® are trademarks of S&P Global, Inc. or its affiliates (“S&P”) and Dow Jones® is a registered trademark of Dow Jones Trademark Holdings LLC (“Dow Jones”), and these trademarks have been licensed for use by SPDJI and sublicensed for certain purposes by the Manager. The ETF is not sponsored, endorsed, sold or promoted by SPDJI, Dow Jones, S&P, their respective affiliates, and none of such parties make any representation regarding the advisability of investing in such product(s) nor do they have any liability for any errors, omissions, or interruptions of the Index.

Commissions, management fees and expenses all may be associated with investments in exchange-traded funds. Please read the ETF Facts or prospectus of the BMO ETFs before investing. The indicated rates of return are the historical annual compounded total returns including changes in unit value and reinvestment of all dividends or distributions and do not take into account sales, redemption, distribution or optional charges or income taxes payable by any unitholder that would have reduced returns. Exchange-traded funds are not guaranteed, their values change frequently and past performance may not be repeated.

For a summary of the risks of an investment in the BMO ETFs, please see the specific risks set out in the BMO ETF’s prospectus. BMO ETFs trade like stocks, fluctuate in market value and may trade at a discount to their net asset value, which may increase the risk of loss. Distributions are not guaranteed and are subject to change and/or elimination.

BMO ETFs are managed and administered by BMO Asset Management Inc., an investment fund manager and a portfolio manager, and a separate legal entity from Bank of Montreal.

BMO Global Asset Management is a brand name under which BMO Asset Management Inc. and BMO Investments Inc. operate.

“BMO (M-bar roundel symbol)” is a registered trademark of Bank of Montreal, used under licence.
