

 Posted By
 Learn how leadership shifts can change your portfolio and how sector rotation can help you respond.
By Saakshi Mehta, VP, ETF and Alternatives Strategy at BMO GAM
(Sponsor Blog)
Market commentary often reduces equity performance to a single question: are markets up or down? But equity markets do not move as a single block. They are made up of many industries, each responding to different economic forces and expectations around growth, risk and profitability. What looks calm at the index level can mask meaningful shifts beneath the surface.
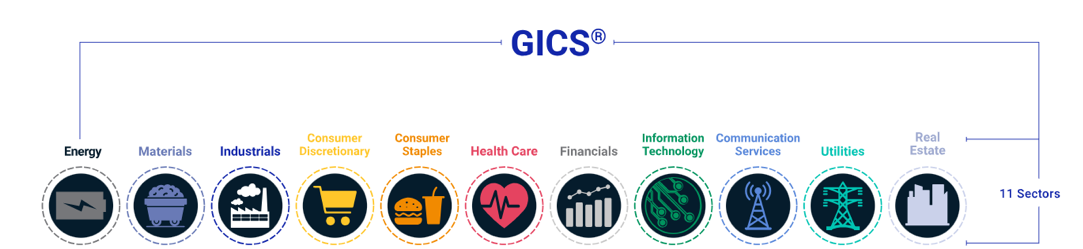
Chart 1 introduces the Global Industry Classification Standard, or GICS, the framework most investors use to define equity sectors. By grouping companies based on their primary business activities, GICS provides a consistent structure for observing how leadership shifts across the market over time.
This is why sector rotation matters. Whether you actively rotate sectors or not, understanding sector exposures is essential for knowing what risks you’re taking and what’s driving your portfolio’s performance. Ignoring sectors can mean flying blind to some of the most important forces affecting your investments.
Sector rotation strategy is a valuable tool for individual investors seeking to enhance returns and manage risk, but it requires discipline, realistic expectations, and an understanding of both the opportunities and challenges involved.
Chart 1: Global Industry Classification Standard (GICS)
Source: MSCI, S&P Dow Jones, BMO GAM
The Core Concept
A sector rotation framework begins with the key observations: where leadership is forming, what forces are driving it, and how sustainable that leadership might be. In that sense, sector rotation is less about forecasting and more about interpreting what markets are already signaling.
The goal is to overweight sectors expected to outperform and underweight or avoid those likely to underperform. Capital tends to move toward areas where expectations are improving and away from areas where optimism has already peaked.
Sector rotation involves shifting your portfolio allocations among different market sectors based on where we are in the economic cycle. This matters because the performance gap between the best and worst sectors in any given year can exceed 15-20 percentage points (Chart 2). Being positioned in the right sectors can meaningfully improve your returns, while being stuck in lagging sectors can significantly hurt performance.
Chart 2: Sector Performance in the US in 2024 and 2025
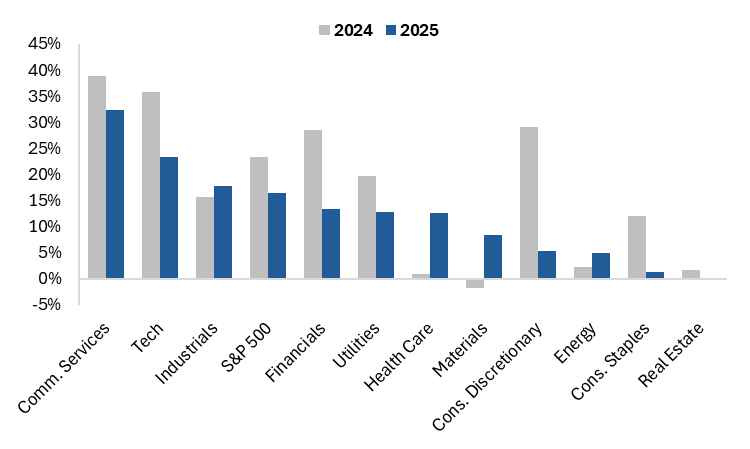 Data as of year-end 2024 and 2025
Source: Bloomberg, BMO GAM
Divergence is a Feature, not a Bug
Sectors are influenced by different economic and structural forces. Interest rates, inflation, regulation, innovation, labour costs and commodity prices do not affect all businesses in the same way. Because these drivers rarely move in sync, sector performance naturally diverges.
That divergence is not a flaw. It is a defining feature of equity markets. It creates periods of concentration, periods of diversification, and conditions that allow leadership to rotate rather than remain fixed.
Market structure adds another layer. Sector composition varies significantly across regions. As Chart 3 shows, U.S. equity markets are heavily weighted toward Technology, while Canadian equity markets are dominated by Financials and resource-linked sectors. The same global environment can therefore produce very different outcomes depending on which market an investor is exposed to.
Understanding this uneven structure helps explain why an index can remain resilient even as many stocks struggle, and why regional markets can move in different directions at the same time.
Chart 3 and 4: Sector Composition in the US vs Canada
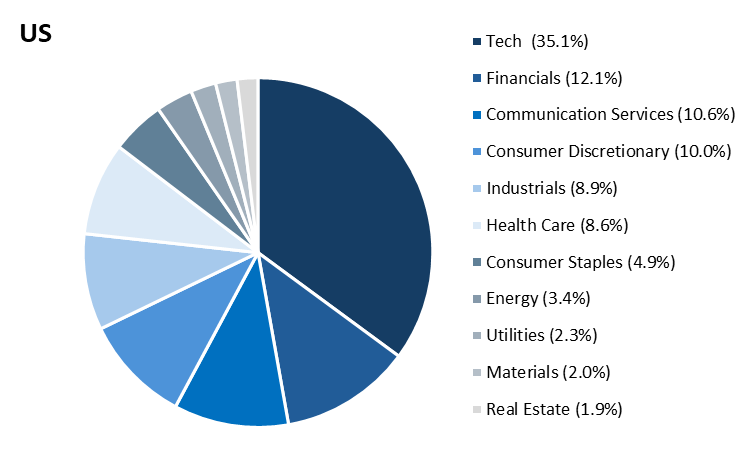
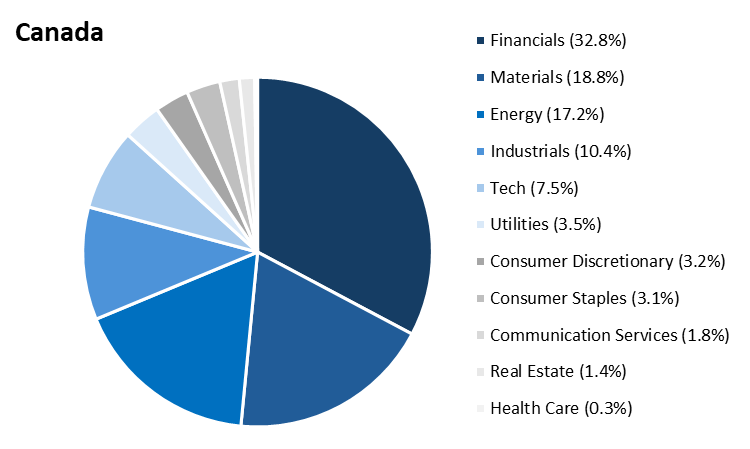
Data as of April 30, 2026
Source: Bloomberg, BMO GAM
How to think about Sector Rotation
There is no single signal that explains sector rotation. Most approaches rely on multiple perspectives, each adding context rather than certainty. Here are a few different frameworks:
1.) Economic conditions provide an important backdrop. Changes in growth momentum and confidence influence earnings expectations and risk profile [1], which tend to be reflected in sector leadership. Cyclical sectors generally benefit from improving growth expectations, while defensive sectors tend to hold up better during periods of uncertainty. Economic data, however, is inherently lagging, and markets frequently reprice before cycles are evident.
2.) Fundamentals and valuations help anchor longer-term risk. Sectors can become cheap or expensive relative to their historical norms or relative to other sectors, creating rotation opportunities. For instance, a P/E ratio of 30 might be expensive for a Utility but cheap for a Technology company. When expectations within a sector become stretched in either direction, the margin for surprise narrows. Over time, these imbalances can create conditions for leadership to rotate, though such shifts often reward patience rather than speed.
3.) Sector concentration creates hidden risks. If you own multiple stocks in the same sector, you have less diversification than you might think. Major indices can become sector-concentrated over time (Technology was over 30% of the S&P 500 in recent years).
4.) Finally, sectors share common drivers that allow investors to assess groups of companies together. For example, the energy sector is shaped by commodity prices and geopolitics. Financials respond to interest rates and credit conditions. Technology reflects innovation cycles and capital spending. Understanding these drivers allows investors to interpret sector behavior without analyzing every stock individually.
Common Mistakes to Avoid
One of the most common mistakes is chasing recent performance. Strong returns often reflect enthusiasm that is already embedded in prices, increasing the risk of disappointment rather than continued outperformance.
Another pitfall is treating sector rotation as a precise timing exercise. Leadership rarely shifts cleanly, and attempting to move at exact inflection points can introduce noise, higher turnover, and behavioral errors.
Investors also frequently overlook differences in regional sector composition. Because equity markets across countries are weighed differently, rotating sectors without accounting for geography can lead to unintended concentrations and risk exposures.
Finally, excessive complexity can erode discipline. Frameworks that react too quickly or rely on too many signals are harder to follow during volatile periods, increasing the likelihood of abandoning the process at the wrong time.
How Sector Rotation shows up in Real Portfolios
In practice, sector rotation is rarely aggressive. Most investors use it alongside a diversified core rather than as a standalone strategy. Allocations typically adjust gradually, reflecting evolving leadership rather than sudden conviction.
Some investors use rotation primarily to prevent long term dominance by a single sector when leadership becomes narrow. Others use it to lean modestly into emerging areas of strength while trimming exposure where leadership has become crowded. In most cases, the process is deliberate, understated and ongoing.
A Practical Starting Point
For individual investors new to sector rotation, consider this simplified framework:
• Start small: Allocate a small percentage of your portfolio to active sector rotation.
• Track key indicators: Monitor unemployment trends, central bank policy direction, and whether corporate earnings are expanding or contracting
• Make gradual shifts: Rather than moving 100% out of one sector and into another, adjust weights incrementally.
• Review regularly: Assess economic conditions and sector positioning at frequent intervals.
• Keep records: Track your decisions and results to learn what works and what doesn’t.
Bottom Line: Sector rotation is not about forecasting which sector will lead next month. It is about understanding how leadership changes over time what are the key drivers and how those changes affect portfolio risk and return. To implement this approach, you can explore BMO sector ETFs at Sector ETFs | BMO Global Asset Management
Note 1: One’s risk profile is comprised of risk tolerance (i.e., willingness to accept risk) and risk capacity (i.e., ability to endure potential financial loss).
 Saakshi Mehta joined BMO Global Asset Management in October 2025 and currently serves as Vice President, ETF and Alternatives Strategy. Her work focuses on macroeconomic trends and their implications for ETF markets, including analysis of monetary policy, fiscal developments, and market structure across asset classes. Prior to joining BMO GAM, Saakshi was part of the Portfolio Strategy team at Ontario Teachers’ Pension Plan. She holds a Master of Financial Economics from the University of Toronto and a Bachelor of Arts in Economics and Psychology from the University of British Columbia.
Disclaimer

This article is sponsored by BMO ETFs and is for information purposes only. The information contained herein is not, and should not be construed as investment, tax or legal advice to any party. Particular investments and/or trading strategies should be evaluated and professional advice should be obtained with respect to any circumstance.

The viewpoints expressed represent the assessment of the markets at the time of publication. Those views are subject to change without notice at any time. The information provided herein does not constitute a solicitation of an offer to buy, or an offer to sell securities nor should the information be relied upon as investment advice. Past performance is no guarantee of future results. This communication is intended for informational purposes only.

Commissions, management fees and expenses all may be associated with investments in exchange-traded funds. Please read the ETF Facts or prospectus of the BMO ETFs before investing. Exchange-traded funds are not guaranteed, their values change frequently and past performance may not be repeated.

For a summary of the risks of an investment in the BMO ETFs, please see the specific risks set out in the ETF facts or prospectus. BMO ETFs trade like stocks, fluctuate in market value and may trade at a discount to their net asset value, which may increase the risk of loss. Distributions are not guaranteed and are subject to change and/or elimination.

BMO ETFs are managed by BMO Asset Management Inc., an investment fund manager, a portfolio manager, and a separate legal entity from Bank of Montreal.

“BMO (M-bar roundel symbol)” is a registered trademark of Bank of Montreal, used under licence.
