

 Posted By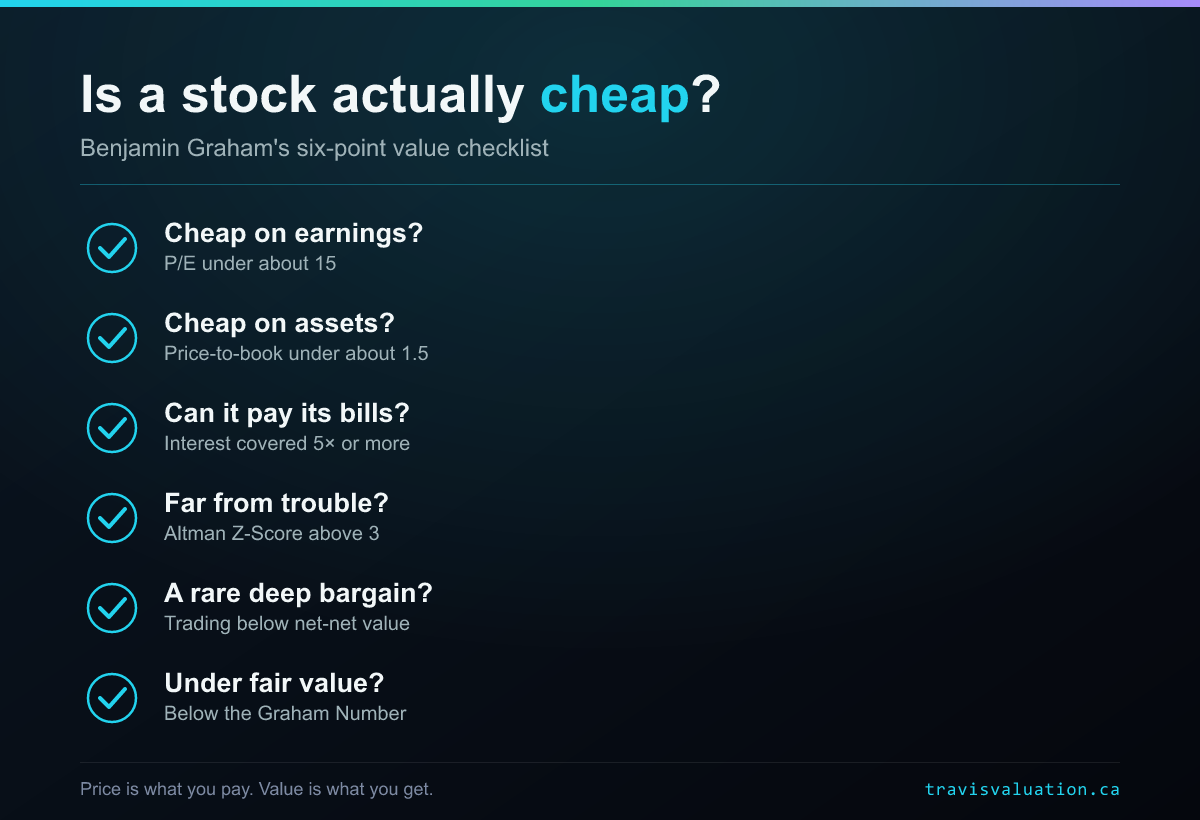
By Curtis Travis
Special to the Financial Independence Hub
Nearly a century ago, Benjamin Graham — the man who taught Warren Buffett — put the whole game in one sentence: “Price is what you pay; value is what you get.”
The trouble is that your brokerage app shows you the price in giant letters and says nothing at all about the value. So, most of us end up buying the number that’s flashing, not the business behind it.
The good news is that estimating what a business is worth doesn’t require a finance degree, a Bloomberg terminal, or a spreadsheet the size of a bedsheet. Graham built his reputation on a handful of simple, repeatable checks that any patient investor can run. What follows is a beginner’s version of that checklist: six questions to ask before you buy. To keep the math clean I’ll use one example company with rounded figures: a fictional-but-typical Canadian retailer trading at $60 a share. (Real numbers move daily, so when you do this for keeps, pull the current figures first.)
Price is what you pay; value is what you’re hunting for
Before the checks, one mindset shift. A $500 stock isn’t “expensive,” and a $5 stock isn’t “cheap.” Cheap and expensive only mean something relative to what you get: the earnings, the assets, and the safety behind the share. Every check below is really the same question asked five different ways: am I paying less than this business is worth?
Check 1: Is it cheap relative to its earnings? (the P/E)
The price-to-earnings ratio is the first thing to look at. Take the share price and divide by earnings per share (EPS). Our retailer earns $5 a share, so at $60 its P/E is 12.
Graham liked to see a P/E under 15. A P/E of 12 means you’re paying $12 for every $1 of annual profit: or, flipped around, an “earnings yield” of about 8%. That’s a reasonable starting point. Anything north of 25–30 means the market is pricing in a lot of future growth, and you’re paying today for profits that may or may not show up.
Check 2: Is it cheap relative to what it owns? (the P/B)
Earnings can be lumpy, so Graham cross-checked price against the company’s book value: roughly, what would be left for shareholders if the company sold its assets and paid off its debts. Divide price by book value per share. Our company’s book value is $40 a share, so its price-to-book is 1.5.
Graham considered 1.5 a sensible ceiling for a defensive investor. Below 1 means you’re buying the assets for less than their stated worth: rare, and worth a closer look. Well above 3 means little of what you’re paying is backed by tangible assets; you’re buying expectations.
Check 3: Can it actually pay its bills? (interest coverage)
A cheap stock that can’t service its debt isn’t a bargain: it’s a trap. Interest coverage tells you how comfortably a company covers its loan payments: take operating earnings (EBIT) and divide by annual interest expense. Our retailer covers its interest 8 times over.
As a rule of thumb, above 5x is comfortable, and below 2x is a flashing yellow light: a bad year could put the company in a squeeze. This one check quietly eliminates a lot of “value traps” that look cheap only because they’re fragile.
Check 4: How close is it to trouble? (the Altman Z-Score)
In the 1960s, professor Edward Altman combined five financial ratios into a single distress-predictor called the Z-Score. You don’t need to compute it by hand, but you should know how to read it:
Above 3.0 — financially healthy. 1.8 to 3.0 — a grey zone; tread carefully. Below 1.8 : elevated risk of serious financial distress.
Our example lands around 3.2: solid. The Z-Score is a wonderful “sniff test” precisely because it’s hard to fool: a company can dress up one ratio, but rarely all five at once.
Check 5: The rare, deep bargain (net-net / net current asset value)
This is Graham’s most famous trick, and his most demanding. Add up only a company’s current assets — cash, receivables, inventory — then subtract all its liabilities. Divide by shares outstanding. If the stock trades below that “net current asset value,” you’re theoretically buying the ongoing business for less than nothing.
For our healthy retailer, this figure comes out well below $60: so it’s not a net-net. That’s normal. True net-nets are extraordinarily rare in today’s market and tend to surface only among tiny, unloved, or beaten-down companies. Don’t expect to find them often: but know the test, because when one appears it’s worth a serious look.
Check 6: Putting one number on it (the Graham Number)
Finally, the payoff: a single fair-value estimate. Graham blended his two favourite yardsticks — a P/E of 15 and a P/B of 1.5 (which multiply to 22.5) — into one formula now called the Graham Number:
Fair value = √(22.5 × EPS × Book Value per Share)
For our company: √(22.5 × $5 × $40) = √4,500 ≈ $67 a share.
So Graham’s rough fair-value ceiling is about $67, and the stock trades at $60: modestly below what the fundamentals justify. Not a screaming bargain, but on the right side of the line. (For faster-growing companies, Graham had a second, growth-based intrinsic-value formula; but the Graham Number is the cleaner place for a beginner to start.)
The checklist, in one place
Before you buy, run these six:
- P/E under ~15? — cheap on earnings
- P/B under ~1.5? — cheap on assets
- Interest coverage above ~5x? — pays its bills
- Altman Z above 3? — not near distress
- Net-net? — rare, but flag it if so
- Price below the Graham Number? — trading under fair value
No single check is gospel. A great company can fail one and still be worth owning; a cheap-looking one can pass a few and still be a trap. But run together, they turn “I have a good feeling about this stock” into something you can actually defend: which is the entire point.
Teaching the next generation to ask the same question
The reason I care about this isn’t nostalgia for a 90-year-old checklist. It’s that a whole generation is learning to invest from apps designed to make trading feel like a game and almost none of them ever ask the one question Graham built his life around: what is this actually worth?
That’s why, alongside the valuation tool, I’ve built free paper-trading and classroom versions so students (and their parents, and anyone starting out) can practise building a portfolio with fake money against real valuations: and even see how a TFSA, RRSP, or non-registered account changes the outcome. My hope is simple: that more young Canadians learn to buy businesses on value, while they’re still young enough to enjoy what that discipline compounds into.
Run the checklist. It won’t make you right every time. But it will stop you from paying the price without ever asking about the value.
 Curtis Travis is a retired AACI-designated appraiser (B.Comm, P.App) and the founder of Travis Valuation (travisvaluation.ca), a Canadian tool that runs Benjamin Graham–style valuations on live data and explains every metric in plain English. He writes a free weekly valuation of a single Canadian stock, and builds free paper-trading and classroom tools to help young Canadians learn to invest with value in mind. This article was written specially for the Financial Independence Hub.
