Posted By
By Hamilton ETFs
(Sponsor Blog)
A little over a year ago, we unveiled Canada’s first suite of daily covered call ETFs, made possible by the evolution of the options market and emergence of options that expire every trading day. The innovative and carefully crafted DayMAX™line-up created a new category in the Canadian ETF market, offering a differentiated approach to generating income. One year later, we’re excited to share the results and demonstrate the strategy’s potential.
What are the DayMAX™ ETFs?
Our first three DayMAX™ ETFs consist of two separate holdings — one providing the core equity exposure and the other providing the underlying for the daily options strategy:
- The core exposure is a HAMILTON CHAMPIONS™ ETF, specifically, CMVP (Canadian Equity), SMVP (U.S. Equity) or QMVP (Technology), which holds blue-chip stocks and participates 100% in market movements.
- A low-cost index fund with healthy options liquidity, like VOO.US or QQQ.US, on which we execute the zero-days-to-expiry (0DTE) options strategy.
Unlike traditional covered call ETFs that use monthly call options and generate income 12 times a year, the DayMAX™ ETFs seek to generate higher and more frequent tax-efficient income from writing call options that expire daily. By selling options in the morning that expire at the market close, the ETFs remain fully exposed to any market movements that occur after trading hours. They also employ modest 25% leverage, intended to enhance overall growth and income potential and help mitigate the yield/return trade-off inherent in covered call strategies.
A year later, these DayMAX™ ETFs have raised a combined $1.3 billion in assets under management (AUM)[1]. Here they are with their respective yields and total returns as of August 31, 2026:
| Fund | 1 Year | Since Inception* | Yield[2] |
| Hamilton Enhanced Canadian Equity DayMAX™ ETF (CDAY) | 32.5% | 33.0% | 18.52% |
| Hamilton Enhanced U.S. Equity DayMAX™ ETF (SDAY) | 19.9% | 20.1% | 18.45% |
| Hamilton Enhanced Technology DayMAX™ ETF (QDAY) | 42.0% | 40.4% | 19.33% |
*Annualized
“It’s encouraging first-year evidence that the strategy is performing as intended,” says Nick Piquard, Chief Options Strategist at Hamilton ETFs. “It’s unique, and we believe we’ve hit the right balance between generating high yield and maintaining a high-quality underlying portfolio. We have successfully married our HAMILTON CHAMPIONS™ ETFs with daily covered calls written on a smaller, modestly leveraged exposure. The leverage is designed to offset the upside we’re giving up on those daily options, and so far, it has done that well.”
DayMAX™ One Year In: Comparisons
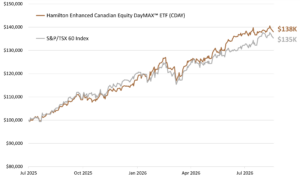
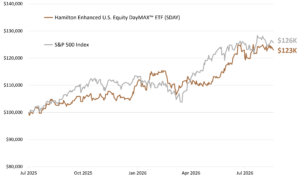
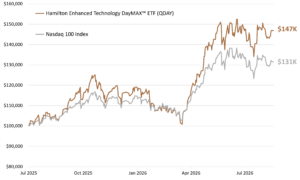
Below, we compare how a $100,000 investment in each of the DayMAX™ ETFs performed since inception against relevant indices on a total return basis. As you can see, CDAY and QDAY have outperformed the S&P/TSX 60 and Nasdaq-100, respectively, while SDAY has closely tracked the S&P 500.
This is particularly noteworthy given that covered call ETFs tend to lag traditional equity ETFs in bull markets, as they give up some upside potential in exchange for generating income. Over the period shown, the DayMAX™ ETFs portfolio construction, use of modest leverage and daily options strategy helped mitigate this trade-off and even deliver higher total returns in some cases.
Canadian Equities: CDAY vs. S&P/TSX 60 Index[3]
U.S. Equities: SDAY vs. S&P 500 Index[4]
Technology: QDAY vs. Nasdaq-100 Index[5]
The DayMAX™ Advantage: What makes the Suite Unique?
The first three DayMAX™ ETFs have delivered strong returns and distributions in their first year. Let’s examine the key design decisions behind the strategy:
Daily options trading
Options trading is the basis of any covered call strategy. Investors sell call options in exchange for cash premiums at the expense of some potential upside. Usually, the call options employed in covered call ETFs expire in a month, but in recent years, same day options or “0DTE” options became possible. These daily options contracts now represent over 60% of all S&P 500 index options volume on a typical day, underscoring both their rapid adoption and deep liquidity[6].
At Hamilton ETFs, we recognized the potential this development held for investors. With options expiring every day of the week, an ETF can generate income daily by monetizing intraday volatility. While the premium on an individual 0DTE option is lower than that of a one-month option, the key difference lies in the trading frequency: monthly strategies sell options 12 times per year, while 0DTE options can be written ~250 times annually. This should translate into higher total premiums and enable us to pay distributions out to investors more frequently — in the DayMAX™ case, twice a month.
It’s important to add that while daily options contracts are a way of monetizing volatility more frequently, they aren’t always a superior strategy.
“There are different scenarios where one does better than the other. If markets are moving a lot on a day-to-day basis but not on a month-to-month basis, then you’re likely better off with a monthly contract,” says Piquard. “On the other hand, if markets are moving steadily, with only smaller daily movements, you’ll probably be better off with a daily options strategy.”
For that reason, we believe DayMAX™ ETFs may complement longer-duration covered call strategies such as our YIELD MAXIMIZER™ ETFs. By combining daily and monthly covered call strategies, income investors can diversify across time horizons, helping to smooth cash flows and tap into a wider range of income opportunities. In essence, DayMAX™ adds another tool to your income toolkit, enhancing flexibility and supporting more frequent income generation.
100% overnight participation
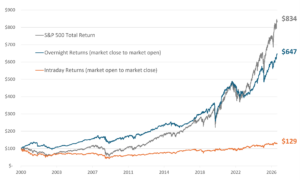
When designing our DayMAX™ line-up, we chose to sell call options in the morning that expire at the end of that same trading day. While 25% of the overall portfolio remains covered during the trading day, limiting the upside on that portion, the full portfolio (i.e., 125% of the ETF’s net asset value) is exposed to market moves outside of regular trading hours. This can make a dramatic difference to long-term returns given that historically the majority of gains happen overnight. (See also: Unlocking Overnight Returns for Covered Call ETFs)
Overnight Returns vs. Intraday Returns — S&P 500 Index[7]
A high-quality portfolio
It takes a lot more than skillful and diligent options trading to make a covered call ETF successful long-term. We designed CDAY, SDAY, and QDAY to have high-quality underlying portfolios that reflect strong fundamentals and diversification. They each hold a HAMILTON CHAMPIONS™ ETF that provides exposure to blue-chip stocks with demonstrated track records in terms of dividends or profitability and forms the foundation for the strategy.
The DayMAX™ suite reflects the innovative spirit, careful consideration and rigorous testing behind everything we do, and we’re optimistic this novel approach will provide many investors with long-term sustainable cashflows.
Key Benefits of the DayMAX Suite:
- Daily call options for higher income: Premiums generated every day
- More frequent payouts: Distributions twice a month
- Full overnight market exposure: The portfolio remains fully exposed to overnight market movements, including both gains and losses.
- High-quality stocks: A diversified, blue-chip underlying portfolio
- Enhanced structure: Modest leverage for higher income and growth potential
- Options expertise: A team with combined experience of 60+ years to execute strategies
Trivia
JPMorgan commodities research team recently said “… we don’t have a baseline view. We simply don’t know how to model the endgame.”² What has the analysts stumped?
Hint: It’s driving stocks in our EMAX ETF this year.
Answer: Oil prices.
The S&P 500 Index and the S&P/TSX 60 Index (“Indices”) and associated data are a product of S&P Dow Jones Indices LLC, its affiliates and/or their licensors and has been licensed for use by Hamilton ETFs © 2026 S&P Dow Jones Indices LLC, its affiliates and/or their licensors. All rights reserved. Redistribution or reproduction in whole or in part are prohibited without written permission of S&P Dow Jones Indices LLC. For more information on any of S&P Dow Jones Indices LLC’s indices please visit www.spdji.com. S&P® is a registered trademark of Standard & Poor’s Financial Services LLC (“SPFS”) and Dow Jones® is a registered trademark of Dow Jones Trademark Holdings LLC (“Dow Jones”). Neither S&P Dow Jones Indices LLC, SPFS, Dow Jones, their affiliates nor their licensors (“S&P DJI”) make any representation or warranty, express or implied, as to the ability of any index to accurately represent the asset class or market sector that it purports to represent and S&P DJI shall have no liability for any errors, omissions, or interruptions of any index or the data included therein.

Commissions, management fees and expenses all may be associated with investments in exchange traded funds (ETFs) managed by Hamilton ETFs. Please read the prospectus before investing. The indicated rates of return are the historical annual compounded total returns including changes in per unit value and reinvestment of all dividends or distributions and does not take into account sales, redemptions, distribution or optional charges or income taxes payable by any securityholder that would have reduced returns. Only the returns for periods of one year or greater are annualized returns. ETFs are not guaranteed, their values change frequently, and past performance may not be repeated.

Certain statements contained in this note may constitute forward-looking information within the meaning of Canadian securities laws. Forward-looking information may relate to a future outlook and anticipated distributions, events or results and may include statements regarding future financial performance. In some cases, forward-looking information can be identified by terms such as “may”, “will”, “should”, “expect”, “anticipate”, “believe”, “intend” or other similar expressions concerning matters that are not historical facts. Actual results may vary from such forward-looking information. Hamilton ETFs undertakes no obligation to update publicly or otherwise revise any forward-looking statement whether as a result of new information, future events or other such factors which affect this information, except as required by law.
[1] As of September 21, 2026. Source: Bloomberg Terminal
[2] Yield is an estimate of the annualized yield an investor would receive if the most recent distribution remained unchanged for the next 12 months, stated as a percentage of the price per unit on August 31, 2026. The yield calculation excludes any additional year end distributions and does not include reinvested distributions.
[3] July 14, 2025, to August 31, 2026. Source: Bloomberg. The graph illustrates the impact to an initial investment of $100,000. It is not intended to reflect future returns on investments in CDAY. The index performance returns are for illustrative purposes only, and the returns do not reflect any management fees, transaction costs or expenses. Investors cannot invest directly in an index.
[4] July 14, 2025, to August 31, 2026. Source: Bloomberg. The graph illustrates the impact to an initial investment of $100,000. It is not intended to reflect future returns on investments in SDAY. The index performance returns are for illustrative purposes only, and the returns do not reflect any management fees, transaction costs or expenses. Investors cannot invest directly in an index.
[5] July 14, 2025, to August 31, 2026. Source: Bloomberg. The graph illustrates the impact to an initial investment of $100,000. It is not intended to reflect future returns on investments in QDAY. The index performance returns are for illustrative purposes only, and the returns do not reflect any management fees, transaction costs or expenses. Investors cannot invest directly in an index.
[6] Source: Cboe, August 5, 2026
[7] Source: Bloomberg, S&P Global, Hamilton ETFs. Past performance is not indicative of future results. Overnight vs. intraday returns may differ materially in future periods. Source: S&P Global, Bloomberg, Hamilton ETFs. Data from Jan 1, 2000, to August 31, 2026. The graph illustrates the growth of an initial investment of $100 in the SPDR S&P 500 ETF Trust (SPY), the SPDR S&P 500 ETF Trust (SPY) overnight, and the SPDR S&P 500 ETF Trust (SPY) intraday with annual compounded total returns. The graph is for illustrative purposes only and intended to demonstrate the historical impact of the indexes compound growth rate during intraday and overnight sessions. It is not a projection of future index performance, nor does it reflect potential returns on investments in the ETF. Investors cannot directly invest in the index. All performance data assumes reinvestment of distributions and excludes management fees, transaction costs, and other expenses which would have impacted an investor’s returns.