All posts by Robb Engen

Canadians have an Income problem, not a Debt problem

BoomerandEcho.com

It’s not hard to find a report about the growing Canadian debt problem. Canadians owe $1.77 for every $1 they make. The average consumer owes $31,400 in installment and auto loans, while borrowing for credit cards and lines of credit average $18,500 per consumer. Finally, there are reports that nearly half of Canadians won’t be able to cover basic living expenses without taking on new debt.

Half of Canadians say they have less than $200 left over at the end of the month, after household bills and debt payments. Canadians’ household savings rate is an abysmal 1.7 per cent.

Canadians have a major debt problem! All the warning signs are there. We’re overextended, borrowing to maintain our cost of living, and at risk of insolvency if a recession hits. It’s a crisis!

Our affordability problem

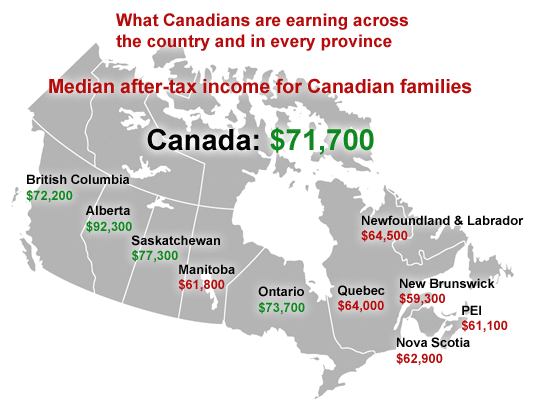
Not so fast. It looks to me like Canadians have an income problem, not a debt problem. Or, put a different way, Canadians have an affordability problem. The median after-tax income for Canadian families is $71,700. Meanwhile, the average house price in Canada is $512,501. That’s an incredible 7x income! For reference, the typical rule of thumb for housing affordability is 2.5x income. That means Canadians should be buying homes worth $179,250.

The discrepancy is even more staggering in B.C. and Ontario:

Avg. house price Median income Affordability
British Columbia $696,115 $72,200 9.64x
Ontario $618,165 $73,700 8.39x

It’s not just housing. Child care costs have risen faster than inflation in nearly two-thirds of cities since 2017. It’s often the single largest household expense after rent or a mortgage. The median cost of child care in Canada’s largest cities hovers around $1,000 per month, with parents in Toronto paying $1,675 per month. The exception is in Quebec, where a universal child care program has been in place for more than two decades (families pay $175 per month for child care in Montreal).

Transportation is the next largest expense for Canadians. On average, we owe $20,000 on our vehicles. The average price of a new vehicle has risen to $37,577. Today, it’s common to see auto loans stretched out over seven or eight years. That helps lower monthly payments slightly, but families are easily paying $500 per month or more on each vehicle (with many two-car families).

Beyond frivolous Debt

All this to say, it’s no wonder Canadians are struggling to get by from month-to-month. We’re accessing cheap credit, in a lot of cases, to fund basic living expenses or cover emergencies. It’s not like we’re out there buying diamonds and furs.

Furthermore, Scott Terrio, insolvency expert at Hoyes Michalos, says it can be misleading to suggest Canadians are so close to insolvency. He says there is a lot of runway between when someone is in financial trouble and when they file a legal insolvency.

“One can be technically insolvent for months, even years, before they need to consider an actual filing. We regularly have clients tell us that they should have come in to see us 12-24 months earlier than they did. That’s because there are all sorts of ways to stave off a legal insolvency.”

Indeed, there are only about 55,000 bankruptcies and 75,000 consumer proposals filed by Canadians every year.

“And there are 37 million Canadians, so you do the math,” says Terrio.

It’s an Income problem

No, we have an income problem that is crippling our ability to save. I’ve seen it firsthand. As a young homeowner, who admittedly got in over his head as a first time buyer, I struggled to pay my mortgage, buy groceries, and service my student loan debt (another issue altogether for young Canadians). Continue Reading…

No, passive investing is not in a bubble

There have been many ridiculous statements made about passive investing over the years. None have garnered as much media attention as hedge-fund manager Michael Burry’s claim that passive investments such as index funds and ETFs are the next bubble. He said these index-tracking investments are “inflating stock and bond prices in a similar way that collateralized debt obligations did for subprime mortgages more than 10 years ago.”

“When the massive inflows into passive vehicles reverse, it will be ugly.” – Michael Burry

Such a bold claim from someone who correctly called the subprime mortgage crisis is certainly cause for concern. But when you peel back the layers, Burry’s statement doesn’t make much sense. Looking for a smarter take than that, I reached out to Erika Toth, a Director of ETFs at BMO Global Asset Management, to explain why passive investing is not in a bubble.

Take it away, Erika:

Debunking Michael Burry’s Passive Investing Bubble Claim

I may not have had Christian Bale play me in a movie, and I did not make millions during the financial crisis, but I have spent years now studying market structure and eating, sleeping, and breathing ETFs. Burry’s comments that sparked a media frenzy (and let’s all agree that the financial media loves to sensationalize) echo some of the most common myths and misconceptions I have encountered on the ETF wrapper.

This “passive investing is in a bubble” argument assumes that all the money invested in passive indices has flowed in to the same indices, that hold the same stocks, in the same proportions. However, there are many different types of passive funds and ETFs: some track the S&P 500, some track indices built around low volatility, quality, value, or momentum filters. Some track specific sectors.

Related: What’s not to love about ETFs?

Different investors have different investment objectives and motivations. Some want to buy the market. Some require higher cash flow. Some require lower volatility. Some are searching to exploit market inefficiencies in order to generate alpha. Pension funds have to make sure their liabilities are funded. Some investors are searching for companies that meet the highest environmental, social, and governance standards. Some require certain tax efficiencies or credit qualities to be met. Therefore, it is impossible that the entire world’s stock and bond markets would move to 100% passive.

It’s also important to note that individual stock ownership by households (domestic and foreign) accounts for just over half of the equity market: the largest share, by far. Mutual funds (active and passive) own about 24%; ETFs own about 6%. Pension funds would represent about 10% (government and private); and about 8% is owned in other vehicles such as hedge funds. (This is according to data put together by the Federal Reserve Board: see below).

ETFs themselves are too small a slice of the overall pie to be able to cause a crash in the prices of the stocks they hold; they simply reflect those prices. Those statistics are for the equity market. ETF ownership of the global bond market is even smaller, roughly 2-3% by most estimates.

The theory that everyone will run to the exits at the same time in the event of a major downturn is incorrect, and 2008 is a good example of that. My favourite example comes from Ray Kerzehro, who is Director of Research at independent firm PWL Capital, in the still-very-relevant white paper he published in 2016.

Kerzehro examines how high yield bond ETFs in the U.S. traded during the height of the financial crisis. Keep in mind that high yield bonds are NOT a large cap equity index made up of the largest and most liquid stocks in the world: they are a riskier asset class of lower credit quality and are less liquid as well. So, even in this riskier and less liquid asset class, there was actually no massive exodus from those ETFs.

What happened is that trading VOLUME actually spiked. Buyers & sellers of the ETF units had different views for different reasons, and the ETF structure actually provided price discovery to an asset class where many of the underlying bonds had gone no-bid. Continue Reading…

Why Robb Engen is striving not for FIRE but to be a FIE (Financially Independent Entrepreneur)

I’ve written before about my modified pursuit of FIRE (Financial Independence, Retire Early). The twist is that I’m striving for FIE: to be a Financially Independent Entrepreneur. It’s an idea that I haven’t been able to get out of my head lately. Here’s why:

For as long as I’ve been writing this blog I’ve had a goal to achieve financial freedom by age 45. I’ve also declared a goal of reaching $1M in net worth by the end of 2021, the year I turn 41.

I’m on pace to achieve that, perhaps slightly ahead of schedule. More importantly, though, is a realization that my so-called side hustle – the online income earned from blogging, freelance writing, and financial planning – has far surpassed my full-time salary. Simply put, I could leave my day job tomorrow and still pull in enough income to meet our spending and savings goals.

So what’s holding me back? A few things. The security of a full-time job with benefits. A wife and two children who depend on my income. A $200,000 mortgage. The angst of where my next freelance contract will come from (and when it will be paid). Navigating the constantly changing online world while trying to earn a living. Having enough of a cushion in the bank in case things go sideways.

Never been busier

I think about all of those things. But the reality is my business has grown by nearly 50 per cent this year. I’ve never been busier, and I know there’s plenty of opportunities I’m leaving on the table because I can only do so much on evenings and weekends. Continue Reading…

VBAL vs. Mawer Balanced Fund for One-stop investing

Investors could have done a lot worse over the past 30 years than investing in the Mawer Balanced Fund. Mawer, which epitomizes the art of boring investing, has been nothing short of consistently brilliant: with annual returns of 8.5 per cent since the fund’s inception in 1988.

Investment giant Vanguard doesn’t have the same longevity or track record here in Canada, but its launch of the Vanguard Balanced ETF portfolio (VBAL) gives investors another one-stop investing option.

This post will go under the hood and compare VBAL to the Mawer Balanced Fund for investors looking for a one-stop investing solution for the next two to three decades.

About Vanguard

Vanguard is legendary in the United States and is largely credited for pioneering low-cost index investing. It came to Canada in December, 2011 and now offers nearly 40 ETFs and four mutual funds to Canadian investors with a total of $17 billion in assets under management (Dec 2018).

VBAL was introduced by Vanguard Canada in January, 2018 as part of a new suite of asset allocation ETFs (including VGRO and later VEQT). These funds have proven popular among Canadian investors and have collectively gathered more than $1 billion in assets.

Before their introduction, investors did not have access to a one-stop ETF solution. Instead, they’d have to build multi-ETF portfolios to get exposure to Canadian, U.S., and International equities, plus another ETF or two for fixed income.

Vanguard turned that around with what I’ve called a game-changing investing solution. VBAL represents the classic 60/40 portfolio.

Vanguard Balanced ETF (VBAL)

VBAL is a fund of funds. That means its underlying holdings are made up of other Vanguard funds. So rather than seeing a bunch of individual stocks and bonds in VBAL’s holdings, you’ll instead see these seven products:

  • Vanguard US Total Market Index ETF
  • Vanguard Canadian Aggregate Bond Index ETF
  • Vanguard FTSE Canada All Cap Index ETF
  • Vanguard FTSE Developed All Cap ex North America Index ETF
  • Vanguard Global ex-US Aggregate Bond Index ETF CAD-hedged
  • Vanguard US Aggregate Bond Index ETF CAD-hedged
  • Vanguard FTSE Emerging Markets All Cap Index ETF

The fund’s mandate is to maintain a long-term strategic asset allocation of equity (approximately 60%) and fixed income (approximately 40%) securities. It’s as diversified, globally, as you can get: with a whopping 12,318 stocks and 15,412 bonds wrapped up inside this one-stop balanced ETF.

VBAL Holdings

VBAL has net assets of $675 million (June 30, 2019). Its distribution or dividend yield is 2.58 per cent (dividends paid quarterly). Its management expense ratio or MER is 0.25 per cent.

Investors can purchase VBAL through a discount brokerage account and it is an eligible investment inside an RRSP, RRIF, RESP, TFSA, DPSP, RDSP, or non-registered account.

VBAL’s performance data only goes back to its inception date of January 24, 2018. It has returned 4.05 per cent annualized since that time, and 10.44 per cent year-to-date (July 30, 2019).

Justin Bender, a portfolio manager at PWL Capital, has simulated the returns as if the fund did exist for the past 20 years and found the following annualized returns (as of June 30, 2019):

  • 1-year return – 5.09%
  • 3-year return – 7.22%
  • 5-year return – 6.62%
  • 10-year return – 7.95%
  • 20-year return – 5.34%

You can read more about VBAL and its fact sheet and prospectus here.

About Mawer

If Vanguard is legendary for pioneering low cost investing, Mawer has achieved cult-like status among active investors for an incredible track record of outperforming its benchmarks. Mawer was founded in 1974. It’s a privately owned, independent investment firm, managing over $55 billion in assets. Mawer has locations in Toronto, Calgary, and Singapore.

While its philosophy is ‘be boring,’ Mawer’s performance is anything but. Of its 13 mutual funds, eight have beaten their benchmark index since inception: including the Mawer Balanced Fund, which trounced its benchmark over the last decade (9.9 per cent to 7.8 per cent). Continue Reading…

Mental Accounting and how we spend money

We all have quirky behaviours when it comes to managing money. One trick we fall victim to is called mental accounting. We separate our money into different types of mental accounts, with different rules, depending upon how we get it, how we spend it, and how it makes us feel.

An easy example is when you have a fund set aside for something like a vacation or house down payment while at the same time carrying high-interest credit-card debt. Or how you decide to spend a $1,200 tax refund versus what you’d do with $100 per month if you had the right amount of tax coming off your paycheque in the first place.

I’m guilty of mental accounting every month when I budget $1,000 for groceries, $200 for dining out, $125 for clothing, and $75 for alcohol. I manipulate those mental accounts all the time, like when I overspend in one category and just take it out of another (shifting a meal from ‘dining’ to ‘entertainment’ for example).

The Mental Accounting challenge

Why do we assign money to these mental categories? One answer is to control how we think about it. If we were perfectly rational and could figure out the opportunity costs and complex trade-offs of every single financial transaction then it wouldn’t matter how we label our money: it would just come from a big pool called ‘our money.’ It’s just money, after all; totally fungible and interchangeable.

But because we’re human with cognitive limitations and emotions we need help with our money decisions. That’s where mental accounting comes in and acts as a useful shortcut for what decisions to make.

Another interesting way we classify our financial decisions has to do with the length of time between when we bought an item and when we consumed it.

Nobel Prize winner Richard Thaler studied wine purchases and consumption and found that advance purchases of wine are often thought of as investments. Months or years later, when the bottle is opened and consumed, the consumption feels free, as if no money was spent on wine that evening. Continue Reading…