All posts by Robb Engen

Two types of overconfident investors

I started investing in individual stocks shortly after the Great Financial Crisis ended in 2009. I picked an investing strategy that closely resembled the Dogs of the TSX, buying the 10 highest yielding Canadian dividend stocks. As you can imagine, the share prices of these companies got hammered during the stock market crash so I was able to scoop up shares in banks, telecos, pipelines, and REITs on the cheap.

Stocks came roaring back right away and my portfolio gained 35% by the end of 2009. Investing is easy, right?

It took me a while to figure out that my portfolio returns had less to do with my stock picking prowess and more to do with market conditions, luck, and the timing of new contributions. The rising tide lifted all ships, including my handful of Canadian dividend stocks.

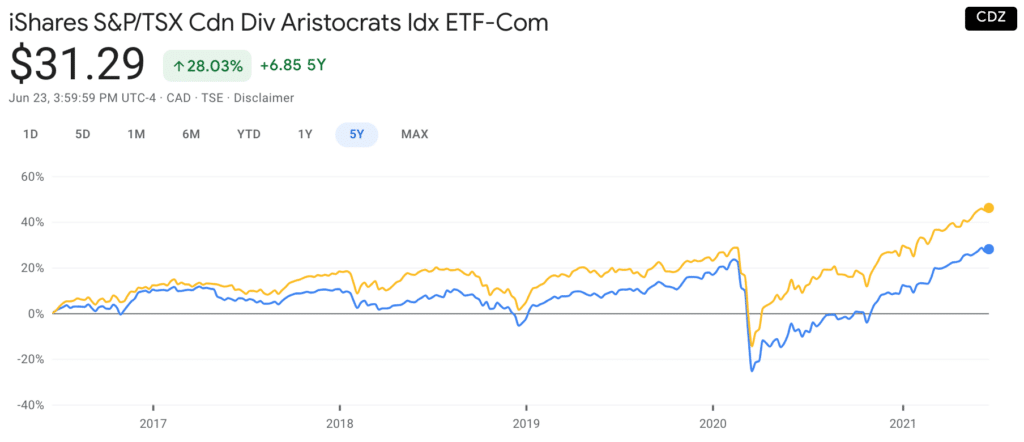
I started comparing my returns to an appropriate benchmark to see if my judgement was adding any value over simply buying a broad market index fund. My portfolio outperformed for a few years until it didn’t. In 2015, I had enough and switched to an index investing strategy. Now I invest in Vanguard’s All Equity ETF (VEQT) across all of my accounts.

Related: Exactly How I Invest My Money

New investors who started trading stocks in the past 18 months have likely had a similar experience. Stocks crashed hard in March 2020, falling 30%+ from the previous month’s all-time highs. Since then markets have been on an absolute tear. The S&P 500 is up 91% from the March 2020 lows. The S&P/TSX 60 is up 70%.

That’s just country specific market indexes, mind you. Since March 2020 individual stocks like Facebook and Apple are up 137% and 155% respectively. Tesla is up 700%. Meme stock darlings AMC and GameStop are up 1,045% and 3,621% respectively.

No doubt, unless they’ve done something disastrous, new investors participating in this market have seen incredible returns so far.

This can lead to overconfidence – when people’s subjective confidence in their own ability is greater than their objective (actual) performance.

Overconfident Investors

Larry Swedroe says the biggest risk confronting most investors is staring at them in the mirror. This is the first type of overconfident investor.

Overconfidence causes investors to trade more. It helps reinforce a belief that any investment wins are due to skill while any failures are simply bad luck. According to Swedroe, individual investors tend to trade more after they experience high stock returns.

Overconfident investors also take on more uncompensated risk by holding fewer stock positions.

Furthermore, overconfident investors tend to rely on past performance to justify their holdings and expectations for future returns. But just because stocks have soared over the past 18 months doesn’t mean that performance will continue over the next 18 months.

In fact, you should adjust your expectations for future returns – especially for individual stocks that have increased by 100% or more. No stock, sector, region, or investing style stays in favour forever. If you tilt your portfolio to yesterday’s winners (US large cap growth stocks) there’s a good chance your portfolio will underperform over the next decade.

The second type of overconfident investor is one who makes active investing decisions based on a strong conviction about how future events will unfold.

Related: Changing Investment Strategies After A Market Crash

Think back to the start of the pandemic. As businesses shut down around the world it seemed obvious that global economies would suffer and fall quickly into a massive recession. The stock market crash reinforced that idea. Investors hate uncertainty, but this time it seemed a near certainty that stock markets would continue to fall and remain in a prolonged bear market.

Markets quickly turned around as central banks and governments doled out massive stimulus to keep their economies afloat and their citizens safe at home. Now it became ‘obvious’ that investing in sectors like groceries, cleaning supplies, online commerce, and video technology would produce strong results. Continue Reading…

Getting your Fixed Income Fix with BMO ETFs

This article has been sponsored by BMO Canada. All opinions are my own.

Fixed income doesn’t get enough attention on this blog, mostly because I’m still in my accumulation years and invest in 100% equities across all my accounts. But most investors should hold bonds in their portfolio to reduce volatility and so they can rebalance (selling bonds to buy more stocks) whenever stocks fall.

In this post we’re going to take a deep dive into BMO’s line-up of fixed income ETFs. We’ll see that there isn’t a one-size-fits-all approach to investing in fixed income, and that investors can capture yield using a wide array of products and strategies.

DIY investors should be familiar with BMO’s suite of fixed income ETFs. It’s the largest in Canada with more than $23 billion in assets. At the top of the list is BMO’s Aggregate Bond Index ETF (ZAG) with total assets of $5.86 billion.

Robo-advised clients also have BMO fixed income ETFs in their model portfolios:

  • Nest Wealth clients hold BMO Aggregate Bond Index ETF – (ZAG)
  • Wealthsimple clients hold BMO Long Federal Bond Index ETF – (ZFL)
  • Questwealth clients hold BMO High Yield US Corp Bond Hedged to CAD Index ETF – (ZHY)
  • ModernAdvisor clients hold BMO Emerging Markets Bond Hedged to CAD Index ETF – (ZEF)

BMO Fixed Income ETFs

Investors are nervous about holding bonds today. Interest rates are at historic lows, and when rates eventually rise, we’ll see bond prices fall – especially longer duration bonds. We’re also seeing higher inflation, which causes interest rates to go up (and bond values to go down).

Q: Erika, investors are concerned about low bond returns, particularly from long-term government bonds. How should they think about the fixed income side of their portfolio?

A: Investors should think of fixed income as a ballast in their portfolio. It helps reduce overall volatility (chart below). Correlations between US Treasuries and stocks (represented by the MSCI USA index) have been negative over the last two decades. All that to say, when stocks fall, bonds tend to do well.

BMO figure 1

Reframing the RRSP advantage

I’ve read a lot of bad takes on RRSP contributions and tax rates over the years. One that stands out is the argument that you should avoid RRSP contributions entirely, and focus instead on investing in your TFSA and (gasp) your non-registered account. This idea tends to come from wealthy retired folks who are upset that their minimum mandatory RRIF withdrawals lead to higher taxes and potential OAS clawbacks. They also seem to forget about the tax deduction generated from their RRSP contributions and the tax-sheltered growth they enjoyed for many years leading up to retirement.

I’m hoping to dispel the notion of an RRSP disadvantage by reframing the way we think about RRSP contributions, RRIF withdrawals, and tax rates. Here’s what I’m thinking:

Most reasonable RRSP versus TFSA comparisons say that it’s best for high income earners to prioritize their RRSP contributions first, while lower income earners should prioritize their TFSA contributions first.

The advantage goes to the RRSP when you can contribute at a higher marginal tax rate and then withdraw at a lower marginal tax rate, while the advantage goes to the TFSA when you contribute at a lower rate and withdraw (tax free) at a higher rate.

If your tax rate in your contribution years is the same as in your withdrawal years then there’s no advantage to prioritizing either account. They’re mirror images of each other.

Related: The next tax bracket myth

This comparison focuses on marginal tax rates. But is this the correct way to frame the discussion?

Marginal Tax Rate vs. Average Tax Rate

Isn’t it fair to say that an RRSP contribution always gives the contributor a tax deduction based on their top marginal tax rate (assuming the deduction is claimed that year)?

But when you look at retirement withdrawals, shouldn’t we focus on the average tax rate and not the marginal tax rate?

An example is Mr. Jones, an Alberta resident with a salary of $97,000 – giving him a marginal tax rate of 30.50% and an average tax rate of 23.59%

Alberta MTR $97k

If Mr. Jones contributes $10,000 to his RRSP he will reduce his taxable income to $87,000 and get tax relief of $3,050 ($10,000 x 30.5%).

RRSP deduction

Fast forward to retirement, where Mr. Jones has taxable income of $60,000 from various income sources, including a defined benefit pension, CPP, OAS, and his $10,000 minimum mandatory RRIF withdrawal.

The range of income in each tax bracket can be quite broad. With $60,000 in taxable income, Mr. Jones is still at a 30.5% marginal tax rate, but his average tax rate is just 19.33%. That’s right, he pays just $11,596 in taxes for the year.

Alberta MTR $60k

Conventional thinking about RRSPs and marginal tax rates would tell us that Mr. Jones should be indifferent about contributing to an RRSP in his working years because he’ll end up in the same marginal tax bracket in retirement.

But when we consider all of our retirement income sources, why do we treat the RRSP/RRIF withdrawals as the last dollars of income taken (at the top marginal rate) instead of, say, income from CPP or OAS or from a defined benefit pension? Why would Mr. Jones’ $10,000 RRIF withdrawal be taxed at 30.5% when it’s his average tax rate that matters? Continue Reading…

Misguided thinking about Dividend Investing

I’ve received an uptick in emails and comments from investors about dividends and so I thought I’d address some common misconceptions around dividend investing.

One reader in particular wanted to know if he should take the commuted value of his pension ($750,000) and put it all in Enbridge stock because it was yielding around 6.5%. That reminds me of the reader who, several years ago, asked if he should borrow money at 4% to buy Canadian Oil Sands stock that was paying an 8% dividend yield.

Related: How did that leveraged investment work out?

I shouldn’t have to tell you why it’s not sensible to put your entire retirement savings into one stock – dividend payer or not.

Most comments were much more sensible and reflected what I perceive to be some misguided thinking about dividend investing.

Dividends + Price Growth = Magic?

Some companies pay a dividend to shareholders. Some do not. Investors shouldn’t have a preference either way.

Amazon doesn’t pay a dividend, focusing instead on reinvesting their profits back into their business for more growth opportunities.

Apple, on the other hand, is awash in cash thanks to the tremendous success of the iPhone and decided to start paying a dividend in 2012. It likely cannot reinvest or grow fast enough to keep up with its cash flow and so it returns some of that cash to shareholders.

Investors shouldn’t prefer Apple to Amazon just because of Apple’s dividend policy.

But what happens when a dividend is paid? The value of the company decreases by the amount of the dividend. That must be true, since the dividend didn’t just appear out of thin air – it came from the company’s earnings.

Company A and Company B are worth $10 each. Company A pays out a $1 dividend, while Company B does not.

Company A is now worth $9, and its shareholders received $1. Company B is still worth $10 and its shareholders received $0.

But some investors do seem to think the dividend comes from thin air and that it does not reduce the value of the dividend paying company.

Consider this example: Let’s say expected stock returns are 8% per year. The average dividend yield from all stocks (both non-dividend payers and dividend payers) is around 2%. That leaves 6% to come from the increase in share prices or capital gains.

Shopify doesn’t pay a dividend. You could consider its expected annual return to be 8% (ignoring the extreme dispersion of possible outcomes for a single stock), but all 8% would come from increases to its share price.

Enbridge has a dividend yield of 6.5%. Should we expect its price to also increase by 8%? Of course not. It would be more reasonable to expect price growth of 1.5% (again, ignoring the extreme dispersion of possible outcomes).

Here’s a more diversified example featuring Vanguard’s VCN (Canadian equities, represented by the yellow line) versus iShares’ CDZ (Canadian dividend aristocrats, in blue):

VCN vs CDZ

Accepting Market Returns

A few readers have expressed concern about their recent investment performance. In most cases, these investors are holding a sensible, low cost, globally diversified portfolio of index funds ranging from conservative (40% stocks, 60% bonds) to balanced (60% stocks, 40% bonds). One reader said:

“Psychologically, it’s tough to put money in when returns have been so low.”

When you invest in a passive portfolio that tracks broad market indexes you can expect to earn market returns minus a small fee. This is far and away the best and most reliable way to invest for the long term.

But sometimes market returns can be disappointing in the short term. Investors might be experiencing that right now. In fact, if you’ve recently moved away from actively managed funds or stock picking to embrace a portfolio of passive index funds, you might be wondering if that was a wise decision.

Market returns have been dismal this year compared to returns from the previous two years. But context matters. FP Canada’s projection and assumption guidelines suggest future expected returns of approximately 4.78% per year for a global balanced portfolio.

Meanwhile, an actual global balanced portfolio represented by Vanguard’s VBAL and iShares’ XBAL returned about 15% in 2019 and 10.5% in 2020. Even a global conservative (40/60) portfolio returned about 12% in 2019 and 10% in 2020. This is highly unusual.