All posts by Financial Independence Hub

Canada’s best Energy Dividend Stocks 2022

Oil and gas pump jacks in Alberta

By Dale Roberts, MillionDollarJourney

Special to the Financial Independence Hub

In August of 2020 we asked if Canada’s energy dividends were in trouble? Of course that was before energy prices and energy stocks were dominating the headlines. At the time Canadian oil prices were about $30 a barrel and energy dividends were under a lot of pressure due to collapsed earnings.

Today, that price has more than tripled and has been above $100 and now sits near $92 (May 2022). You’ll notice when you compare the Western Canadian Select price to Brent (closer to $105) just how much Canada’s energy dividends and earnings would benefit from not having to discount relative to world price! That said, that gap in price has been closing. And the generous oil prices have fuelled incredible earnings and dividend growth.

oil stock chart
western canadian stock chart
source: https://oilprice.com/oil-price-charts/

Those higher oil prices are wonderful for Canadian oil producers, mostly operating or active in the Canadian oil sands, but many of the producers also have global operations. They have already become free cash flow gushers. More investors, fund managers and retail investors are going along for the ride.

Over the last year, the returns for the TSX Capped Energy Index are more than 90%. If we go back to the start date of this Canadian energy stock series (August 2020) the energy index is up over 300%.

On my site, I had suggested last October that investors consider Canadian oil producers.

I offered …

“The Canadian energy sector has been beaten up. Foreign investors have given up and so have many Canadian investors. Where there is incredible pessimism there can be incredible rewards. But there is certainly no guarantee that the pessimism for the Canadian energy patch is not deserved.

That said, it is also certainly possible that the pessimism has jumped the shark. There may be incredible value in the energy sector for Canadian investors.”

Canadian investors who went against the flow were rewarded handsomely, and it was not as big a risk as many would think. The macroeconomic and energy-specific story was quite simple.

Economic activity and energy usage was certain to pick up as we made our way through the pandemic. Canadian energy producers were made more lean and mean by the tough years in the energy patch. They had already spent the required amounts (CAPEX investments) to make their oil projects viable and profitable at lower oil prices. If prices do get to $50 a barrel and more, they have a license to print money.

Canada’s Largest Energy Stocks Comparison

Ticker

Company

Price

Market Cap

P/E

Dividend Yield

ENB.TO

Enbridge

56.94

116.26B

19.78

6.03%

TRP.TO

TC Energy

73.13

72.42B

22.11

4.91%

CNQ.TO

Canadian Natural Resources

79.19

91.96B

9.94

3.81%

SU.TO

Suncor

48.57

70.23B

11.30

3.87%

IMO.TO

Imperial Oil

65.22

43.41B

13.68

2.11%

CVE.TO

Cenovus Energy

27.07

53B

99.68

1.57%

PPL.TO

Pembina Pipeline

50.35

27.81B

22.06

4.98%

???.??

(Hidden, click for access)

??????  (Hidden, click for access)


??????  (Hidden, click for access)

??

??.??

?.??%

As you can tell from the chart above, if you’re a risk averse dividend investor, Canada’s pipeline’s are a much more stable bet (although potentially with much less of an upside) over the medium- and long-term.

Mike Heroux – the man behind DSR – is a CFA and has been studying Canada’s dividend players for several decades. His free webinars on the value of the mid-stream pipeline companies (they’re not building any more of them) versus the mercurial nature of the oil companies themselves really makes sense. You can read our full Dividend Stock Rocks review here.

Visit DSR Now & Get Our Exclusive Discount

The Long-term Strength of Energy Stock Dividends

The story on energy stocks has evolved, in that our green desires do not match the energy reality. Today there are reasonable fears of an energy crunch that could turn into an energy crisis. The renewable energy transition will take a decade or two.

In the meantime we have increasing demand for oil and gas and greatly decreased CAPEX: there’s little desire to look for more oil and gas. In fact, it’s politically unfashionable to suggest that we need more oil and gas, or to spend the time and money necessary to find and produce more oil and gas.

That sets up a secular and positive trend for traditional oil and gas. It is an unfortunate reality.

The story goes back to the most basic economic principle: supply and demand.

On the bullish side, Eric Nuttall, portfolio manager at NinePoint Partners, suggests it is a generational investment opportunity. Eric often reminds us that the free cash flow that many of these companies produce is beyond generous, it is ridiculous. They can quickly pay down debt, buy back shares and return more value to shareholders by way of generous dividend increases.

The Big Oil Stocks Idea

Looking at returns for Canada’s “Big 3” oil stocks over the last year have been eye-opening.

Here is the portfolio income chart from that post, with a hypothetical starting amount of $10,000. It is an equal weight portfolio of The Big 3. We see that there was no oil drought, no oil recession for the investor that went ‘big’ with their Canadian energy stock selection.

canadian energy stocks portfolio income
Source: Portfolio Visualizer

The big oil stock consideration was and is Canadian Natural Resources (CNQ), Suncor (SU) and Imperial Oil (IMO). In Million Dollar Journey’s post on the top Canadian Dividend Growth Stocks you’ll find ‘The Big 3’.

In August of 2020 I noted that the dividends had held up reasonably well.

  • Canadian Natural Resources (CNQ) had maintained its dividend and offered a yield of almost 6.3%.
  • Imperial Oil (IMO) has maintained its dividend and at the time delivered a yield of almost 3.8%.
  • After a dividend cut of 55% Suncor (SU) was down to a yield of 3.7%.

But the free cash flow is now feeding sweet dividend increases, or should we say dividend gushers.

  • In April of 2021 CNQ increased its dividend by 10.6%, followed by 25% and 27.7% increases
  • In July of 2021 IMO increased its dividend by 22.7% followed by a 25.9% increase
  • In December of 2021 SU increased its dividend by 100% (in June of 2022 they gave it another 11.90% boost.

The Canadian Energy Stocks Dividend Growth Scorecard

From the time of the first energy stock article on MDJ.

  • CNQ, 0.425 to 0.75 an increase of 76.5%
  • SU, 0.21 to 0.47 an increase of 123%
  • IMO, 0.22 to 0.34 an increase of 54.5%

The Big 3 offered an average of 84.7% dividend growth over less than a 2-year period.

I had suggested that the oil and gas sector has the potential to be the greatest source of dividend growth within the Canadian market. That is playing out in spades. Of course Canadian investors were also keeping an eye on Canadian bank stocks.

Regulators had forced the banks to suspend dividend increases and share buybacks during the pandemic. Those restrictions were removed, and we were treated to double digit dividend growth for Canadian banks and financials.

We expect more dividend growth announcements this month.

What if you had Investedin the Big 3 Oil Stocks?

From that time of that post you would have seen some generous and growing income. That said, you would also have total returns that would have almost tripled the total returns compared to the TSX Composite.

energy stocks vs etf portfolio growth
Source: Portfolio Visualizer

You’ll also see the pipelines in there. Those are my two pipe holdings, Enbridge (ENB) and TC Energy (TRP). You’ll find those companies in the portfolio that focuses on Canadian Wide Moat Stocks and are stellar Canadian dividend all stars.

They matched the returns of the market for the period. They have been offering a wonderful inflation hedge as well. While the pipes don’t have the torque of the energy producers, they have delivered returns of over 16% in 2022, to the end of April.

energy stocks annual returns
Source: Portfolio Visualizer

Back in 2020, I had suggested that I would stick with being a toll taker, collecting tolls and dividends by way of those pipelines that move the oil and gas around North America. Of course, Enbridge and TC Energy are much more diversified and do have energy producing operations as well. Continue Reading…

How Low-Volatility ETFs can help in this environment

By Sa’ad Rana, Senior Associate – ETF Online Distribution, BMO ETFs

(Sponsor Blog)

With recent market volatility, investors are demanding solutions that stay afloat during market ups and downs. When looking at behavioural finance studies around loss aversion, an interesting finding arises that people’s fear of loss is (psychologically) twice as powerful versus the pleasure they experience from gains. This is one reason we have seen investors pulling money out of the markets in the past couple months. In reality, this may be a disservice to themselves, if they could just stay invested in a solution that could ease those bumps in the road, they would be better off. Low Volatility investing is one such solution.

So, what is Low Volatility (Low Vol) Investing? Well, it is an approach to investing that allows one to gain equity exposure for some possible growth in their portfolio while providing downside protection.

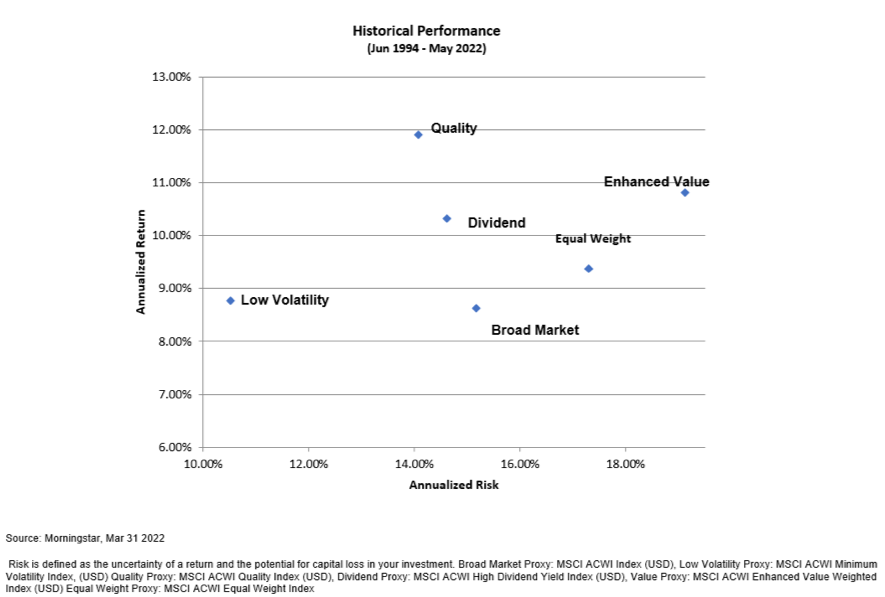
The chart below (long-term historical performance of the MSCI ACWI – global equities) perfectly demonstrates this. Low Vol is sitting a little bit higher than the broad market (from a returns aspect) but, yet significantly reducing risk. Low Vol sitting at around 10%, whereas the average equity risk is approx. around 15%.

Measuring Low volatility and BMO ETFs’ Approach

Low-volatility is a type of factor-based investing, which is a process that is repeatable and disciplined in its execution. Therefore, in order to invest in this manner, you need to use metrics to identify between what is considered a low volatility stock vs. a high volatility stock. There are a lot of different approaches in the market. The two most prevalent are the Low Beta and Standard Deviation methodologies.

Beta is a risk metric that measures an investment’s sensitivity to fluctuations in the broad market (market sensitivity). The broad market is assigned a beta value of 1.00, an investment with a beta less than 1.00 indicates the investment is less risky relative to the broad market. Low beta investments are less volatile than the broad market and can be considered defensive investments. Over the long term, low-beta stocks may benefit from smaller declines during market corrections and still increase during advancing markets. Additionally, low-beta stocks tend to be more mature and provide higher dividend yield than the broad market. Continue Reading…

Age Tech: a Coming of Age Story?

By Mark Venning, ChangeRangers.com

Special to the Financial Independence Hub

Is Age Tech a Coming of Age story?

Well you might think so, given all of sudden it seems, how far but quickly we’ve come, to where we’re at now, this point in 2022. While on the one hand Age Tech is a coming of age story, in the world at large it is either unheard of, or if it is heard of in some circles, it is either misunderstood or too confusing in its jumble of jargon for everyday people to grasp. Even some in this emerging industry question whether Age Tech is the best term to use. So what’s the story?

Perhaps we should start at the beginning with once upon a time. Simply the story goes, in the 1970s some engineers, industrial designers and gerontologists were curious and asked a question about how technology could join up with the field of aging studies and, as noted in the 2009 publication Defining Gerontechnology for R&D Purposes: they “recognized the need for a conceptual framework.”

Along came the 1980s, the marriage of gerontology and technology: Gerontechnology. Originator of that term in 1988, Jan A.M. Graafmans was part of a research team in Eindhoven University of Technology, “that started an effort to develop a program of research and education in gerontechnology aiming at further integration of engineering sciences with those disciplines already involved in aging studies.” Read his The History and Incubation of Gerontechnology.

As an inter-disciplinary, academic and research field, Gerontechnology established itself in 1997 forming the International Society for Gerontechnology (ISG). Speaking of jargon, at the best of times Gerontechnology is a mouthful to say let alone to understand fast. On the ISG website it is described as designing technology and environment for independent living and social participation of older persons in good health, comfort and safety.”

Fast forward. My journey with technology and aging began in 2013 when Stanford Centre on Longevity kicked off its Longevity Design Challenge competition. In 2015 I followed Canada’s newly formed technology and aging network AGE-WELL. To appreciate the development of Gerontechnology, I highly recommend the 24 collected papers compiled by editor, Sunkyo Kwon – Gerontechnology: Research. Practice and Principles in the field of Technology and Aging. [cover on the left]

But even then all this did not quite make a coming of age story. Until now. Roughly since 2020, Age Tech has become the fast term that has at least made for an easier conversation starter. The real secret in explaining what it means is the ability to link up the Age Tech talk to the human needs it services. All you need are three examples everyday people can identify with, such as health and home care, mobility and transportation & social connection.

Avoiding the risk of overwhelming you here, to prove that there is a real coming of age marketplace for Age Tech, there are several new resources that can help you quickly do your own research; and no doubt some of you may have experienced some of the products available, even if their brand recognition is low.

Recently published (2022) is the book by Keren Etkin – The AgeTech Revolution. If you want to be bedazzled before you read the book, on Etkin’s website The Gerontechnologist you will find a very busy Age Tech Market Map filled with brand logos under various categories and sub-categories from health and wellness to tech-enabled home care.

Early in March at last AGE-WELL with help from the Centre for Technology Adoption for Aging in the North (CTAAN) published Canada’s Agetech Startup Map (seen at the top of this blog). Actually if you click on the logos on the PDF link you will find the websites for all the brand names featured. On the CTAAN web page for Age Tech you will find links to products listed under six clear topic headings, some more products not listed on the Agetech Startup Map.

If you think this is all hype and are not yet convinced that Age Tech has arrived at its coming of age, then you soon should be convinced after you check out some of what I’ve highlighted here. Try some of this out as a conversation starter next time you meet up with friends to test market awareness as it were. And because I can’t resist I’ll leave you with one more.

Poking around as I do, to see what’s covered on Age Tech in other parts of the world, I found a snappy article What is Age Tech? by Andreea Toma, dated 2020 from a UK based marketing agency Creative Quills (love that name.) Toma’s quill keeps it simple: “AgeTech is an emerging group of technologies which seeks to improve the lives of older adults.”

Mark Venning is a writer, speaker, researcher and advisor on the business, technology, health & social aspects of ageing and longevity which include changing concepts in a longevity society for Age Inclusive Communities. He is an Associate Member of the International Federation on Ageing.

This blog originally appeared on March 15, 2022 and is republished here with his permission. 

Today Self vs Tomorrow Self

By Mark Seed, myownadvisor

Special to the Financial Independence Hub

From one of my favourite blogs and podcasts to listen to (Farnam Street), I recently read a few lines about today-self and tomorrow-self that offered up some reflection.

In a nutshell:

“There is a constant battle in all of us between our today-self and our tomorrow-self.”

Today-self tends to care about today … looking for immediate gratification or in some cases, avoiding doing things today that can be done tomorrow. Very child-like.

Tomorrow-self is like our inner adult, who has the knowledge and experience that it takes time to get meaningful results. That could be working on things like your career, your relationships or your financial independence journey.

From the Farnam post:

“Imagine you are tasked with building a brick wall. Today-self looks at the empty space in disbelief, discouraged at the size of the project. Today-self decides to start tomorrow. Only tomorrow never comes because the empty space again seems insurmountable. Today-self decides to talk about the wall they’re going to build, as if it were the same as building the wall. It’s not.

Tomorrow-self knows that no one builds a wall all at once. It’s going to take a month of consistent effort from the time you start before it’s done. Tomorrow-self wishes you’d stop thinking about the wall and focus on one brick.”

How true.

So, as so many sayings tend to go related to behavioural psychology for any sort of success:

think BIG, act small. 

Life is complex. Life is very uncertain. We can be easily and often overwhelmed by the magnitude of things and things to do.

At the end of the day, while we need to have our long-term brick wall in mind, we should just focus on one or two bricks each day. Do some of the smallest things well that move you forward. Then repeat. The logic is simple but not simplistic.

From The Behavior Gap:

Simple but not Easy

The wisdom of tomorrow-self is this: Focus on one thing you can do today to make tomorrow easier. Repeat.

(Click here to share this Tiny Thought on Twitter.)

More Weekend Reading…

Thinking about today-self and tomorrow-self, that’s a good reflection for this chart: Continue Reading…

Maintaining Balance in Volatile Markets

Franklin Templeton/Getty Images

By Ian Riach, Portfolio Manager,

Franklin Templeton Investment Solutions

(Sponsor Content)

It’s been a volatile first half of the year for the world’s capital markets. In many countries, both equities and fixed income have declined, which has led to the second-worst performance for balanced portfolios in 30 years. Typically, bonds outperform stocks in down markets, but not this time. In fact, this has been the worst start to the year for fixed income in the past 40 years, thanks to higher inflation and the resultant rise in interest rates.

Supply-side inflation harder to tame

Central banks use rate hikes as a tool to curb demand for goods and services; but the current inflation is being driven more by supply-side issues stemming largely from the COVID-19 pandemic and exacerbated by the Russia/Ukraine war. Unfortunately, central banks have little influence over supply. All they can do is try to dampen demand with an aggressive interest-rate adjustment process, but they must be careful not to overshoot. Raising rates too quickly runs the risk of tipping weak economies over the edge into recession territory.

Canada’s most recent inflation imprint, released in June, showed an increase to 7.7% year-over-year. One negative consequence is that real incomes are being squeezed as inflation continues to accelerate.

Rates are rising quickly

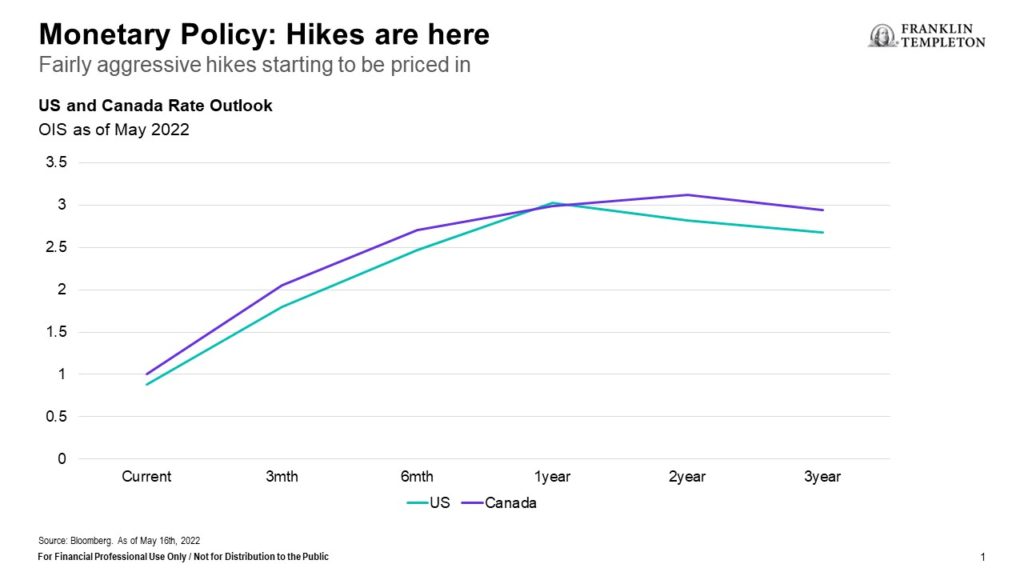
Both the U.S. Federal Reserve (Fed) and Bank of Canada (BoC) have increased their overnight lending rates from essentially 0% prior to March of this year to 1.5%-plus in June. The Canadian futures market had priced another 75-basis point (bp) increase at BoC meeting in July, which ended up an even higher 100-bps with indications of more to come in September.

Rising interest rates are hurting several sectors of Canada’s economy, notably real estate — especially risky for the economy as housing and renovations have been leading Gross Domestic Product (GDP) growth for the past few years. A significant correction in that sector could lead to a recession.

If there is any silver lining in the current situation, it may be in the Canadian dollar versus its U.S. counterpart. Short-term rates in Canada have moved higher than in the United States. This differential, along with the direction of oil prices, affects the value of the Canadian dollar against the U.S. dollar. If the differential widens and stays higher in Canada, the loonie will likely benefit.

Recession risks are growing

The likelihood of recession is hotly debated within our investment team. Recession in North America is not our base case, but a soft landing will be very difficult. We are currently in a stagflationary environment and recession risks are increasing daily. Europe may already be in recession.

The stock market is a good leading economic indicator, and its recent decline indicates the risk of recession is rising. In addition, the yield curve is very flat, which typically portends an economic slowdown. These market signals have somewhat altered our team’s thinking. Given the current environment, we are reducing risk in our portfolios. In fact, we recently went slightly underweight equities.

Regionally, we are reducing the Europe weighting as that region is more exposed to the negative headwinds associated with war. We are slightly overweight the U.S. but acknowledge that valuations are subject to disappointment with declining earnings growth. We are overweight Canada, which continues to benefit from rising resource prices. Continue Reading…