By Billy and Akaisha Kaderli, RetireEarlyLifestyle.com
Special to Financial Independence Hub
Interview with Lori and Randy Grant, Professional House Sitters
Many people would like to know more about house sitting — the ins and outs, what to expect, how to get started, and if it’s really feasible to do house sitting as a lifestyle.
Lori and Randy Grant, professional house sitters, were more than generous with their time in answering our questions, and in providing photos and a couple of house sitting stories at the end of this interview.
If you would like to try house sitting, take advantage of what Randy and Lori know.
Enjoy our interview!
 Randy and Lori enjoying a side trip to Santorini, Greece between house sits
Retire Early Lifestyle: Could you tell us a little bit about yourselves and why you decided to do some house sitting in your retirement?
Lori and Randy Grant: Randy and I are former teachers whose careers took us overseas to Japan for sixteen years, where we taught U.S. military dependents at the high school level. After our son, Chase, left Japan to go to college in Florida, we started thinking about making our own exit. At first, it was just daydreaming about being location independent, financially independent, and doing whatever brings us joy every day. Finally, we took the big leap, started selling everything we owned, and accepted an early retirement incentive package from our teaching careers in 2014. It was a slightly terrifying, but mostly exhilarating experience to jettison ourselves to complete freedom.
Our first year in early retirement was spent exploring Thailand’s culture and language. We really took that time to settle into our new lifestyle, and there were a few ups and downs for me. I lost my daily structure that teaching brought me, so I struggled to find a new routine to my days. That’s where house and pet sitting became a good fit for us. We started out by just being asked to watch family and friends’ houses and pets while they went away on vacation. Soon, we found that the word-of-mouth about us was filling our calendar with sits all over the place! We eventually joined an online house and pet sitting site and put a profile online advertising our services, which are free, to a worldwide database of homeowners looking for the perfect sitters.
Retire Early Lifestyle: How long have you and Randy have been house sitting as a way to enhance your retirement and travel?
Lori and Randy Grant: We have been doing this off and on for approximately five years.
Retire Early Lifestyle: Could you tell our readers how you work this to your benefit? Lori and Randy Grant:
Since lodging is one of the biggest expenses as we travel, this is a great way to cut that major cost. House and pet sitting is a free service. We trade out for free rent and utilities in the home where we stay. Another added benefit is that since we are in an area longer than just a few days, we get to explore the area more in depth. We actually feel like part of a neighborhood! We really believe that pet sitting is a win-win situation for all involved because pet owners get to keep their pets in their own environment rather than facing the stress and expense of kenneling them.
 Randy enjoying a neighborhood in winter
Retire Early Lifestyle: Would you recommend house sitting as a lifestyle or as a way to reduce housing costs in retirement?
Lori and Randy Grant: Absolutely! The money you save in rent can then be used for something else.
Retire Early Lifestyle: Can a single house sit? How about a single woman? Is it harder for a single to house sit?
Lori and Randy Grant: We don’t think it matters as long as you are a fit for what the homeowners are looking for. Some applications will request either a couple or a single person if they have a specific preference. You might also see a request for non-smokers or people who are willing to spend most of their time at home with the pets, rather than those who are interested more in sightseeing around the area.
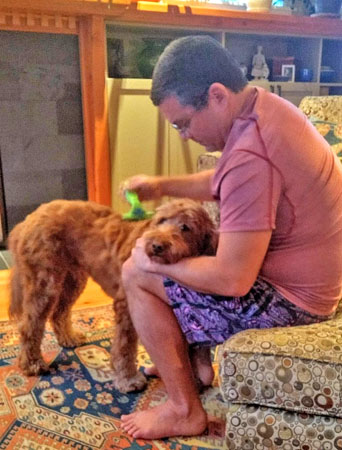 Randy brushing Calvin after a walk during a pet sit in Bellingham, WA
Retire Early Lifestyle: What if I want to house sit in a foreign country but don’t speak the language?
Lori and Randy Grant: It could potentially be an issue; however, it usually depends on the owner. We had a house sit that we applied for in Venice, Italy and we weren’t selected for it because the owner wanted someone who spoke Italian. These days, we have no qualms about house sitting in a country where we don’t speak the language. Google Translate Online is our main form of communication in cases where we are not familiar with the language. That, and we always manage to meet up with other English speakers wherever we roam.
Retire Early Lifestyle: What does a House Sitter do?
Lori and Randy Grant: Usually an owner will leave specific instructions on how they want their home and pet cared for and what things need to be taken care of in their absence. Our main priority is the pet’s needs such as their feeding, exercise, and daily routine. After that, we focus on keeping the home tidy and well maintained, the yard or garden spruced up, as well as the trash and recycling disposed of properly. The remainder of the time we do whatever we want such as hiking, yoga, cooking, and exploring the local area.
 Besides pet sitting, we are also sometimes responsible for keeping yards and pools maintained
Retire Early Lifestyle: How do I get started? Do I have to join a house sitting organization?
Lori and Randy Grant: We started out with just doing favors for friends and family by watching their home and pets. Then, from that experience we built a house and pet sitting profile online that included recommendations from homeowners whom we’d sat for previously. Finally, as we came to the realization that we really enjoyed house and pet sitting regularly, we joined a house sitting site online to get more worldwide exposure.
Retire Early Lifestyle: How do I interview for a house sit?
Lori and Randy Grant: The first thing to do is apply for the house sit on whatever forum you choose such as a Facebook site, an online house sitting site, or via a community message board. Owners will then look over your profile to determine if you are a good match. If you are on their ‘short list’ (one of their top three applicants), you may be asked to interview over the phone or video chat through Skype. This gives the owners and sitters an opportunity to meet face to face. It also gives you the ability to see the pets and have a look at the house. After your video chat/interview, wait for the owners to contact you that you’ve either been selected or they have chosen other sitters. If you’re selected, you then begin a regular conversation so that you can ask questions, share your travel plans to their home and get more detailed information about their pet’s needs.
 Making new four-legged friends on the malecon in Ajijic, Mexico
Retire Early Lifestyle: How much should I charge for house sitting?
Lori and Randy Grant: We do not charge for our services. It is an even exchange of pet sitting for free lodging.
Retire Early Lifestyle: Is house sitting safe?
Lori and Randy Grant: We have always felt safe with our house sits, but remember to always do your research before agreeing to a sit. Look at the area where the sit is located and talk to the owners about the neighborhood, as well as the home’s specific security measures.
Retire Early Lifestyle: Do you require anything from the homeowner when you take a house sitting job?
Lori and Randy Grant: We have a list of questions we ask about the pet’s daily routine and anything we need to know about how things run in the house. We don’t require anything specific, other than good wifi.
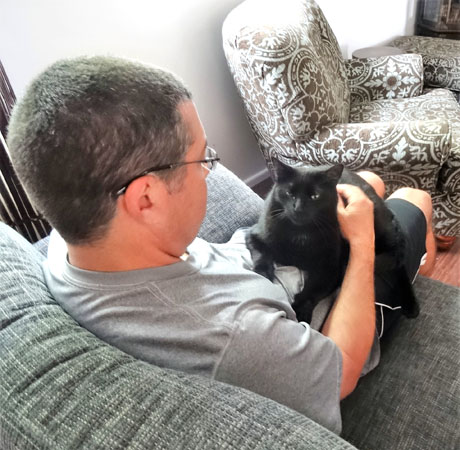
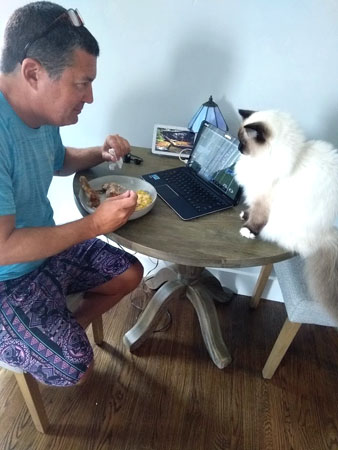 Randy and Fawkes having a staring contest during a pet sit in San Francisco, CA
Retire Early Lifestyle: How do you choose one sit over another?
Lori and Randy Grant: We usually look at the area where we most want to travel and if the sit coincides with the dates that we will be in that area. We also prefer sits that are not too isolated or in very remote, rural areas. We tend to choose sits that are more town/city centered so that there are more options for things to do.
Retire Early Lifestyle: What do you look for when you are wanting to find a house sit in a certain location?
Lori and Randy Grant: We look for the length of the sit mostly. We prefer the longer sits (over two weeks long) if we can get them. If we are constantly traveling to lots of different short term sits, then it becomes cost prohibitive for us regarding our transportation expenses.
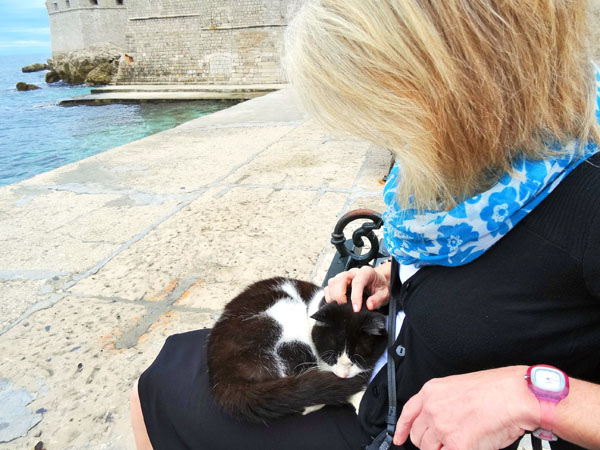 Lori is a warm lap for a stray kitty in Dubrovnik, Croatia
Retire Early Lifestyle: Do I have to pay my own travel expenses?
Lori and Randy Grant: Yes. It would be extremely rare to find a sit where the homeowners agreed to pay for a sitter’s travel expenses. However, many homeowners have offered to pick us up from the airport or train station when we arrive, which is a very nice gesture.
Retire Early Lifestyle: Can I find popular destinations like Hawaii or Paris?
Lori and Randy Grant: Absolutely, but apply early, as those sits tend to have many applicants vying for them.
Retire Early Lifestyle: Can I travel the world by house sitting?
Lori and Randy Grant: Sure you can. We are doing it!
 Randy introducing himself to Flash in Kaiserlautern, Germany
Retire Early Lifestyle: Can house sitting help me avoid paying rent? Can I do this all year round? Where do I go between house sits? Continue Reading…


 Devin Partida is the Editor-in-Chief of ReHack.com, and a personal finance writer. Though she is interested in all kinds of topics, she has steadily increased her knowledge of the intersection of finance and technology. Devin’s work has been featured on Entrepreneur, Due and Nasdaq.