An organization called Generation Squeeze is calling for big cuts to Old Age Security (OAS). For some reason, these cuts are aimed exclusively at senior couples. Digging into the numbers, the proposal makes no sense.
The stated goal of the proposed OAS changes is to free up government money for other priorities. Whether or not OAS is the right target for reducing government spending is a different discussion. The puzzling part of this proposal is having all the cuts apply to senior couples.
Currently, OAS will get clawed back from any senior whose 2025 net income (Line 23400 of the tax return) is over $93,454. For each dollar over this income threshold, OAS payments are reduced by 15 cents. The current rules make no distinction between singles and couples. The calculation is based on each person’s own income without regard to whether they have a spouse.
It’s more expensive for two people to live than just one
Generation Squeeze wants to change the threshold to $100,000 for total household income. So, single seniors would lose nothing, and senior couples would eat all of the cuts. The problem here is that it is more expensive for two people to live than just one. The figure actuaries use is that it costs about 40% more for two people in the same home to live than it costs for one person. Continue Reading…
You did everything right for retirement in Canada. Then you started spending winters down south, and a different rulebook quietly took over.
Royalty-free image courtesy TheNorthernOffice.ca
By Alex Setzler
Special to Financal Independence Hub
Ask a Canadian snowbird how many days they can spend in the U.S. before things get complicated, and most give the same answer: 182. Stay under half the year and you’re fine. That number is comforting. It’s also the wrong number, and trusting it is how careful savers walk into problems they never saw coming.
Over the past year I’ve talked with a lot of Canadians who split their time across the border, and the same five traps catch them again and again. Here they are:
1.) The day count is weighted, and it bites earlier than 182
The 182-day rule people repeat is a Canadian idea, tied to provincial health coverage and Canadian residency. The IRS doesn’t use it. The U.S. uses the Substantial Presence Test, and it counts three years at once: all of your days this year, plus a third of last year’s days, plus a sixth of the days from the year before. Cross 183 weighted days and the IRS can treat you as a US tax resident, taxable on your worldwide income.
Run the math and it’s sneakier than people expect. Spend about 120 days a year in the U.S. every year, and you land right on the edge. Four months each winter (roughly 122 days) puts you over. Not half the year. A third of it.
There’s a release valve. If you stay under 183 actual days in the current year, you can usually file Form 8840, the Closer Connection Exception, and tell the IRS your real home is Canada. It isn’t automatic. You file it every year, by June 15.
Miss the deadline, or spend one day past 182, and the exception is gone.
The number that protects you was never 182. It’s the paperwork.
2.) Your TFSA, the account Canadians love most, is the one the IRS likes least
The TFSA is close to a national treasure. Tax-free growth, tax-free withdrawals, no catch. In Canada.
Cross the border and the catch shows up. The U.S. doesn’t recognize the TFSA as tax-free. The treaty protection that shelters your RRSP doesn’t extend to it. So the income growing “tax-free” inside your TFSA can be fully taxable to the U.S., and the account itself may be treated as a foreign trust, which drags in extra reporting forms whose penalties start in the five figures.
The reporting piece is genuinely unsettled. Cross-border tax pros still argue about exactly which forms a TFSA triggers, and the IRS hasn’t given a clean answer. When the experts aren’t sure, “assume it’s fine” is not the safe move.
3.) The RESP carries the same surprise, right when you need the money
If you opened a Registered Education Savings Plan (RESP)( for your kids, same story. The U.S. doesn’t see it as the tax-sheltered education account it is in Canada. The growth, and in some cases the government grant money, can become a US tax and reporting question at the worst possible time: when your kid starts school and you’re pulling the money out.
4.) FBAR: the form that has nothing to do with tax, and still bites
This one catches people because it isn’t about how much tax you owe. f you’re a U.S. tax resident and your Canadian accounts added together ever cross $10,000 USD at any single moment in the year, you have to report them to the U.S. Treasury on an FBAR. Chequing, savings, RRSP, TFSA, the business account, all of it, combined.
Ten thousand dollars isn’t a wealthy-person number. One paycheque or a moved-over down payment clears it. And the penalties for skipping it were built for people hiding money offshore, which means they’re harsh, and they don’t care that you simply didn’t know. The form is easy. Not knowing it exists is the expensive part.
5.) The good-news trap: your RRSP is fine, so people guard the wrong account
Here’s the flip. After all that, the account most people worry about, the RRSP, is the one the treaty actually protects.
Under the Canada-US tax treaty you can defer U.S. tax on the growth inside your RRSP until you take the money out, same as you do in Canada. The old extra form for it got scrapped years ago. Continue Reading…
By Dale Roberts, Retirement Club/cutthecrapinvesting
Special to Financial Independence Hub
It appears to be an overlooked part of retirement planning. While we should always invest within our risk tolerance level we should also match our investment portfolios to the retirement cash flow plan. The plan gives the marching orders for each account. If you create a portfolio-to-plan mismatch, you could increase the risk of depleting an account too soon. On the other side if you are too conservative where an account has the time horizon to run, you create opportunity cost. You missed the opportunity to create significantly more wealth over time.
As always the following is not advice.
We can look to the Canadian asset allocation ETFs for a lesson on risk and asset allocation. In that post that tracks the performance of the asset allocation ETF providers, you’ll find this key table.
Source: Dale/ETF providers. Keep in mind there is no guarantee of returns for any period
We can see that when our time horizon is short we create conservative portfolios with lots of bonds and cash. When we have a longer time horizon of 10 years and more, we can be more aggressive perhaps even holding an all-equity portfolio. But once again, risk tolerance permitting.
I recently discussed risk and common mistakes on the BMO ETF Insights YouTube channel.
In the accumulation stage we might pay attention to this chart if you are saving for a home and plan to buy within the next two years. If would be very risk to hold those home down payment funds in an all equity (XEQT-T) portfolio. Your $100,000 could quickly be turned into $50,000 in a severe bear market.
Sequence of returns risk in retirement
Risk gets flipped in retirement. In the accumulation stage if you have 20 years to go before retirement and we enter a severe bear market, “great”. You can now buy your companies/equities at fire-sale prices. Over time that can generate a boost to your wealth creation. You own more of those great companies. Continue Reading…
As we noted in a blog sent out on Canada Day, Findependence Hub registered users are invited to watch a special webinar on investing in AI stocks produced by TSInetwork.ca and The Successful Investor’s Pat Mckeough, a long-time contributor of blogs to the site.
The markets in 2025 were volatile, largely due to the implementation of U.S. tariffs. Despite this, investors who stayed the course were rewarded as markets finished the year on a stronger footing.
That said, a new challenge emerged in 2025 that carried into this year: Artificial Intelligence stocks.
Markets are once again volatile, and many investors are asking:
Should I invest in AI stocks? If so, which companies make sense? … OR
Is there a risk of an AI bubble that could impact the broader market?
In short: what should Successful Investors do?
In an exclusive webinar created by TSInetwork.ca and The Successful Investor, we’ll address these questions and more next Tuesday, July 7th, at 11:30 am EST.
This is a valuable opportunity for readers of Findependence Hub to hear insights based on Pat McKeough’s investment approach. As regular subscribers will know, Pat has been contributing guest blogs to Findependence Hub since its inception in 2014.
We’ll also leave plenty of time to answer your own questions about AI, current market conditions, and what to expect for the remainder of 2026.
As a thank you for attending, Canadian registrants are also eligible to receive a complimentary wealth management consultation with Bob Wiseman, a member of the Successful Investor Client Onboarding Team.
Please feel free to invite a family member or friend: just forward this blog by email and have them click the “Register Now” button above.
If you want a diversified large-cap Canadian equity fund with the added benefit of earning passive income beyond dividends, our new ETF may just be the one-ticket solution for you.
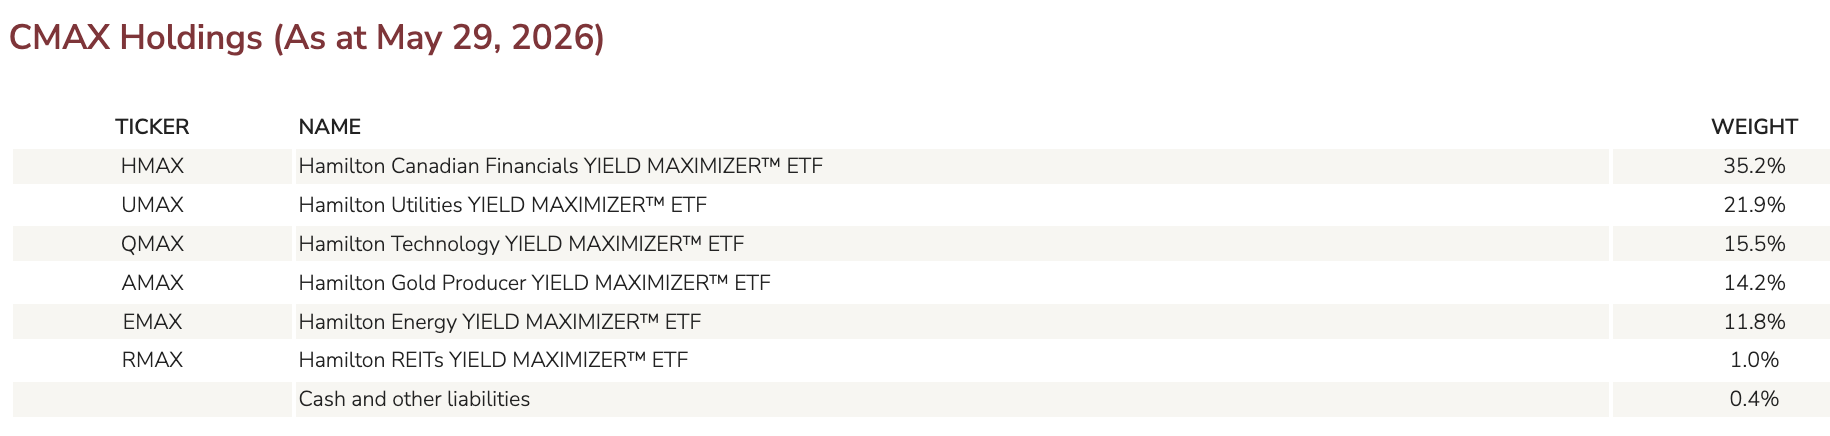
CMAX invests in six of our established sector-focused YIELD MAXIMIZER™ ETFs and is designed to broadly resemble the S&P/TSX 60 index in terms of sector weightings. Each of the underlying funds is managed by our experienced options team, which actively writes at-the-money options on the underlying stock holdings to generate income in the form of premiums.
The result is a diversified Canadian equity portfolio with a heavy focus on Canadian bank and insurance stocks, which have long been core holdings for many Canadian investors. CMAX also has meaningful exposure to utilities, telecoms and gold producer stocks, often considered defensive during periods of market volatility.
While CMAX closely reflects the Canadian large-cap stock market, it also holds select U.S. stocks through its underlying ETFs. Investors may ask why a Canadian-focused ETF includes U.S. equities rather than sticking strictly to Canadian names.
The answer is diversification. While CMAX is designed to provide a sector mix broadly similar to the S&P/TSX 60, it also makes what we believe are some important improvements. The Canadian technology sector, for example, is heavily concentrated, with Constellation Software, Shopify and Celestica representing roughly 75% of the sector[1].
Rather than replicate that concentration, CMAX gets its technology exposure through the Hamilton Technology YIELD MAXIMIZER™ ETF (QMAX). This addition provides exposure to a broader group of technology heavyweights like chipmakers NVIDIA, Intel, AMD and Micron, and the FAANGs, which add some prudent diversification, strength and quality to the portfolio.
More choice for income-seeking investors
With covered call ETFs like CMAX, investors can maintain their equity exposure while earning a higher tax-efficient yield to supplement other sources of income. It depends on your own unique financial position and needs, but if you want a balance of capital growth and income and don’t just want to focus on one sector, CMAX may be the right choice to add to your portfolio.
CMAX is part of our broader equity YIELD MAXIMIZER™ lineup, which also includes SMAX for U.S. equity exposure and IMAX for international equity exposure. Each ETF gives investors a simple way to choose the market exposure they want while accessing our active covered call strategy for monthly income. Continue Reading…

 By Michael J. Wiener,