John De Goey/STANDUP Advisors/Designed Securities Ltd.
By John De Goey, CFP, CIM
Special to Financial Independence Hub
One thing I do constantly is think about risk exposure and uncertainty. I try to actively think ahead on behalf of clients. What do they want and need? In doing that, I aim to be realistic in how I assess options, accepting that no one can be truly certain about anything.
In addition, I know that many investors seek relief from decision fatigue, volatility anxiety, and the burden of constant monitoring. I set out to address those challenges. Coming to a working framework has taken awhile.
In fact, it took until a few years ago for the regulatory framework in Canada to truly make sense. Until then, client suitability revolved around the concept of Strategic Asset Allocation. How much money was in cash, how much in bonds, and how much in stocks?
Taking no more Risk than is absolutely necessary
It has only been in the past few years that the way regulators think about portfolio construction has been brought in line with the way most people intuitively think about market instability and investment suitability. The goal is to get people the return they need while experiencing risk they can handle, but no more than absolutely necessary.
Until recently, portfolio managers were obligated to write investment policy statements that spell out a client’s strategic asset allocation based on discrete asset classes. Now, regulators assess suitability through the dual lens of risk tolerance in risk capacity. Tolerance is a matter of psychographic disposition. Capacity is a matter of investable asset levels and cash flows through income.
Portfolios need to be constructed to reflect the more conservative of those two tests. Accordingly, products that are rated as low-, medium-, or high-risk can be combined to create portfolios that correspond to a client’s risk appetite. Regulators have even added two intermediate risk profiles: low-to-medium and medium-to-high. Think of all products rated on a scale of 1 to 5, with low risk as a one and high risk as a 5. Investors can mix and match based on risk/return characteristics rather than clumsy asset class depictions.
Using 2022 as a case study, we can all see how this more contemporary approach is of great value to retail investors. Under the old model, a traditional balanced portfolio (60% stocks; 40% bonds) would have been forced to lose money when considering rate hikes that everyone knew were on the horizon. Being forced to have a 40% allocation to bonds in what was almost certain to be a short-term bond bear market is simply inconsistent with the principle of responsible risk management. The system was failing people, but mercifully, those days are over. Continue Reading…
Today we’ll look at the core Canadian equity ETFs that you might use when you build a global ETF portfolio. The Canadian stock market is dominated by financials and energy. It is not a well-diversified index. It might be a case of pick your poison, a level of ‘undiversification.’
That said, the weakness of the Canadian stock market is quickly picked up by U.S. and International market ETFs. Also, Canadian stocks can add a layer of inflation protection that is missing from the U.S. market. Once again, we’re coming back to the beauty of a global ETF portfolio, on the Sunday Reads.
Off the top, what do we mean by buying the stock market of a country or region? Have a read of … What is index investing?
Building your global ETF portfolio
For an overview of ETF portfolio building, check out the ETF model portfolio page. We’re going to build around the core assets …
You can certainly add more assets such as gold, REITs (real estate) plus U.S. and international bonds, but many Canadians will stop with a simple but effective core ETF portfolio.
The core models are offered at Tangerine Investments where I was an investment advisor and trainer for several years.
Canadian Core Equity ETFs
The most popular index used to capture the Canadian stock market is the TSX Composite. To buy the ETF that tracks the index you could use the ticker XIC-T.
The index holds 300 of the largest publicly traded companies in Canada across many sectors.
We can see that the index is dominated by Financials, Energy and Materials. It is not a well diversified index / stock market. That said, the index plays to Canada’s strengths by design. We have one of the strongest banking and insurance industries in the world, and we have the oil and gas and materials that North America and the world needs. Canadian banks have historically outperformed just about everything over the longer term (even including U.S. stocks, the S&P 500), but that doesn’t mean that you necessarily want to go all in on Canadian financials.
Another popular index for Canada is the TSX 60 ticker XIU-T. The index holds 60 of the largest companies in Canada. Here is the sector breakdown.
XIC is moving to a period of outperformance, says Morningstar due to greater exposure to materials, and less reliance on financials compared to XIU. We can say that XIC is more “diversified.” The materials index includes gold and other mining stocks that are on a tear.
Here’s the materials ETF vs XIC.
Gold and materials are very inflation-friendly. You can see the spike in the COVID period as well when we had a brief inflation scare.
iShares Core S&P/TSX Capped Composite Index ETF XIC
Retirement should feel like a reward for decades of hard work, not a financial tightrope walk. As the cost of living fluctuates, many Canadians near or in retirement worry about their nest egg stretching far enough.
You can take control of your financial future by making strategic adjustments today. Simple life changes can help you preserve your wealth and enjoy greater peace of mind.
Below, we explore the top ways to lower your monthly expenses in 2026 so you can navigate the year with confidence.
1.) Review your Auto Insurance Policy
Auto insurance premiums often creep up unnoticed and eat away at your monthly budget. A renewal notice might arrive showing a higher rate than the previous term. There are several reasons why your car insurance premium might suddenly go up, such as a change in address, adding a new driver to your policy, or a lapse in coverage. Even a minor speeding ticket can impact your rates for years.
Furthermore, industry-wide inflation raises repair costs, which insurers pass on to policyholders. If you notice a spike in your bill, take some time to address the root cause. You might lower this cost by shopping for new quotes, increasing your deductible, or bundling your home and auto policies.
2.) Track your Daily Spending
You cannot fix what you do not measure. Many individuals know their income figures but lack clarity on exactly where money exits their accounts. To solve this, subtract your savings from your after-tax earnings to determine what you actually spend. This simple calculation often reveals surprising leaks in your budget.
Once you identify where funds go, you can decide which expenses add value and which you can eliminate. Maintaining positive cash is a great financial New Year’s resolution for 2026 that will keep your retirement plan on track regardless of market volatility.
3.) Audit your Digital Subscriptions
Automatic payments quietly drain bank accounts. It’s easy to accumulate streaming services, cloud storage plans, and app subscriptions that you rarely use. Sit down with your credit-card statement, and identify every recurring charge. Cancel any service that you have not used in the last three months. Check whether family plans or annual payment options offer a lower overall rate for the services you choose to keep. Continue Reading…
Utilities have long played an important role in investor portfolios, often valued for their stability and diversification benefits. As providers of essential services such as electricity, natural gas, and infrastructure, these businesses tend to exhibit steady demand across economic cycles. In terms of investing, how investors access the utilities sector can matter just as much as the characteristics of the sector itself.
Many traditional utilities ETFs track market-cap-weighted benchmarks designed to own the entire utilities universe. While this approach provides broad exposure, it can also introduce structural inefficiencies. Market-cap weighting can overweight the largest companies, resulting in portfolios where a small number of names dominate overall exposure (i.e. concentration risk). In addition, market-cap weighting continues to increase allocations to companies as their market values grow, reinforcing exposure to recent top performers rather than maintaining a more even distribution across the sector.
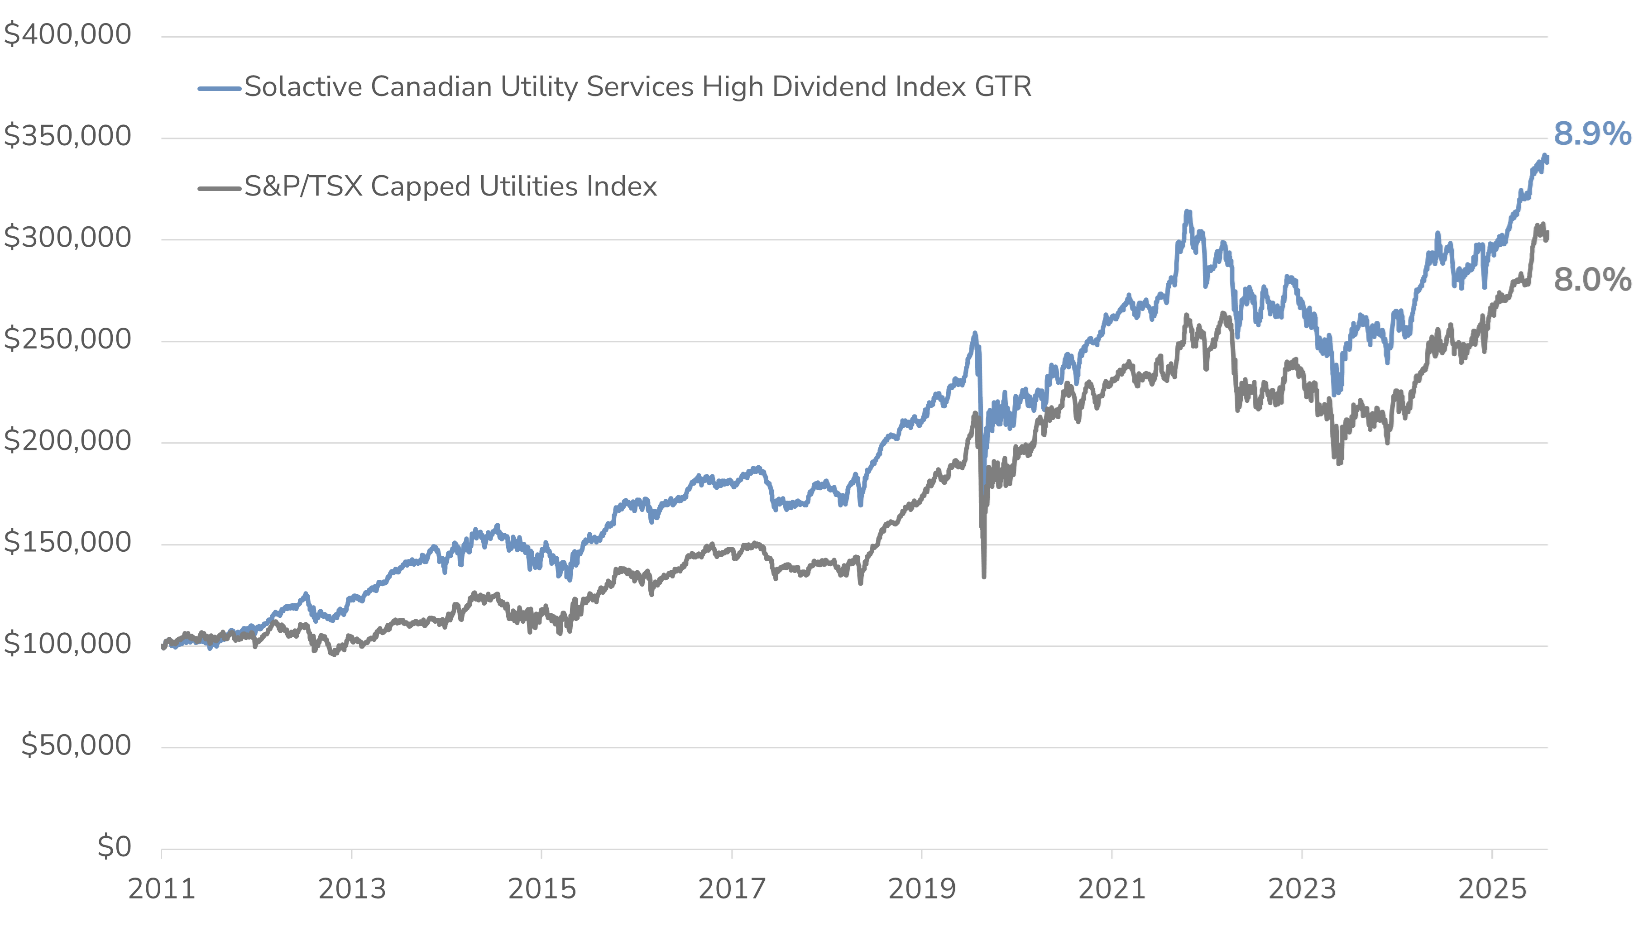
The HAMILTON CHAMPIONS™ Utilities Index ETF (UMVP) follows the Solactive Canadian Utility Services High Dividend Index GTR(“Utilities Index”), which was designed to take a more selective approach. Rather than owning the entire utilities universe, the Utilities Index expands beyond traditional utilities to include pipelines and telecommunications companies, focusing on the largest companies across each sub-sector. These sub-sectors share similar business characteristics, including infrastructure-heavy operations and relatively stable demand. By equally weighting its holdings and rebalancing semi-annually, UMVP aims to provide a more balanced and diversified way to access essential services at a low management fee of 0.19%.
Why Invest in Utilities
Investors often allocate to utilities to help diversify their equity portfolios and moderate overall volatility. Demand for essential services tends to be less sensitive to economic cycles, which can make utilities a stabilizing component within a broader portfolio. Over time, these characteristics have made utilities a popular core allocation for investors seeking reliability alongside growth.
UMVP’s Utilities Index builds on this role by broadening the opportunity set beyond traditional utilities. By including pipelines and telecommunications companies, the Utilities Index captures a wider range of essential service providers while maintaining a focus on businesses with similar operating profiles.
This performance reflects a more balanced approach to essential services investing. By expanding beyond traditional utilities and avoiding the overconcentration that can arise in market-cap-weighted indexes, the index UMVP tracks has benefited from exposure to proven companies across a broader opportunity set for low cost (0.19% management fee).
UMVP — Index Outperformance¹
The Limits of Traditional Utility Indices
Most traditional utility indices are built with two structural features that can limit their effectiveness:
First, market-cap weighting can lead to concentration risk, as the largest companies in the sector receive the largest weights. Over time, this can result in a portfolio where a small number of holdings account for a disproportionate share of total exposure.
Second, market-cap-weighted indexes tend to increase allocations to companies as they grow larger, reinforcing exposure to recent top performers. This structure can limit the opportunity to maintain balanced exposure across the sector, particularly when leadership shifts over time.
UMVP’s Utilities Index addresses both shortcomings with three key differences:
Expanding the universe beyond traditional utilities to include telecoms and pipelines
Selecting the largest companies in each sub-sector: utilities (6), telecoms (3), pipelines (3)
Equally weighting the 12 holdings to minimize overconcentration (rebalanced semi-annually)
Where UMVP Fits in a Portfolio
We believe UMVP can serve as a low-cost core utility holding within a diversified equity portfolio. By focusing on the largest companies across essential service providers, UMVP provides exposure to businesses that tend to exhibit more stable demand while participating in long-term equity growth, all at an annual management fee of 0.19%. Continue Reading…
Should I stay, or should I go? If I go, there will be trouble
And if I stay, it will be double
So come on and let me know Should I stay or should I go?
— Should I Stay or Should I Go, by The Clash
Bubble or No Bubble?
During the latter part of 2025, one of the most common topics in both the media and in conversations with clients was whether markets are in a bubble, particularly with respect to AI-related companies. Given the spectacular multi-year ascent of many tech stocks and their sky-high valuations, it is unsurprising that many investors harbour serious concerns regarding a potential comeuppance.
Nobody can know for certain whether such a bubble exists, let alone how and when the proverbial story will end. However, analyzing the current environment from a risk-reward standpoint can provide investors with a useful framework to consider their current portfolio allocations and to determine whether changes are warranted.
Between a Rock & a Hard Place: Loss vs. Opportunity Cost
All bubbles, both perceived and actual, harbour the two key risks of loss and opportunity cost (i.e., missing the boat).
All bubbles eventually burst and leave a wake of losses when they do. However, in instances of false alarm where suspicions of a bubble prove unfounded, those who run for the hills suffer the opportunity cost of missing the proverbial party and leaving significant sums of money on the table.
Even in cases where the bubble moniker has proven to be accurate, things have not been straightforward. Given that irrationality and emotions are the root cause of excesses, bubbles tend to grow much bigger and to persist far longer than what may seem possible (one need look no further than Japanese stocks in the 1980s or tech stocks in the late 1990s to validate this statement). Unlike the false alarm scenario, significant losses do eventually materialize. However, this does not change the fact that investors who step aside before the comeuppance can nonetheless suffer significant opportunity costs as prices continue their often-parabolic extent long after alarm bells begin ringing.
That being said, opportunity cost is not merely comprised of the returns on the investments you forsake, but rather how those missed returns compare to those of the assets for which you forsake them. Even in instances where shunned assets deliver positive returns, if their returns are no greater or less than those of the holdings which replaced them, then the net opportunity cost is zero. Alternately stated, it’s not just about the returns you’re missing, but rather about the returns of what you’re missing vs. the returns you’re getting in their stead.
Not all Bubbles are Created Equal: A Trip down Bad Memory Lane
Historically, different bubbles have been accompanied by very different investment environments, which in turn have presented investors with vastly different prospective risks and returns. This fact is clearly evident across the three debacles of the new millennium, which include the dotcom bubble of the late 1990s/early 2000s, the global financial crisis of 2008-9, and the fixed-income duration bubble of 2021-22.
Whereas there is no such thing as a good bubble (by definition, they all eventually burst), some bubbles occur in environments that are far more ominous than others. In the worst cases, the prospective opportunity costs of avoiding them are acute. Conversely, there are bubbles during which the prospective opportunity costs of avoidance are far less pronounced. In essence, the greater the potential returns are for non-bubble assets, the lower the associated opportunity costs of avoiding the bubble.
The Dotcom Bubble (2000-3): Attractive Alternatives aplenty
The aftermath of the dotcom bubble resulted in significant losses for many investors. In early 2000, U.S. large-cap stocks stood at their highest valuations in modern history. Given the historically inverse relationship between valuations and future returns, it should have been no surprise that disappointment ensued. Between the summer of 2000 and the spring of 2003, the S&P 500 Index declined by 45% in inflation-adjusted terms, while the tech-oriented Nasdaq Composite Index fell 79%.
However, these losses were largely avoidable while simultaneously achieving reasonable returns elsewhere. Emerging-market equities, emerging-market bonds, and REITs exhibited valuations that suggested decent returns over the medium term. While not particularly inspiring, even TIPS and cash were yielding 4% and 2% above inflation, respectively. In essence, investors who were willing to re-allocate based on relative valuations were not backed into a corner: they were not forced to endure meaningfully subpar returns by avoiding what appeared to be (and were subsequently proven to be) overvalued assets.
The Everything Bubble (2007-8): Nowhere to Hide except Bonds
The “Everything Bubble” of 2007-8 and the global financial crisis that followed were entirely different animals. By the time the good times had peaked in 2007, practically all risky equity markets had become overpriced, foreshadowing negative returns over the next several years regardless of country or region.
Unlike the case with the dotcom bubble, only safe-harbour assets such as TIPS, government bonds, and cash offered positive albeit meagre returns. The only way to avoid significant losses was to liquidate all risk assets (as opposed to reallocating within them), hide in safe assets, and accept lackluster albeit positive returns. While doing so would not have been ideal, it nonetheless would have been the least bad alternative.
The Duration Bubble (2021): Nowhere to Hide
The duration bubble of 2021 bore a far greater resemblance to its 2007-8 predecessor than to the dotcom bubble, and in some respects was even more problematic. Investors were stuck between the “rock” of overvalued equities and the “hard place” of bond yields that were substantially below inflation levels. Only cash, which was the only asset that didn’t suffer losses, failed to keep pace with inflation. Continue Reading…