My latest MoneySense Retired Money column has just been published. Click on hypertext for full column: Why Vanguard’s ETF aimed at retirees is currently cautious in its asset allocation.
The column originated from a mid-January Vanguard Canada briefing with two of its economists held for the Canadian media in downtown Toronto. You can find at least two news stories on the web filed shortly after the event by Bloomberg News and Investment Executive.
While the general thrust of the press conference was on the opportunities for Canada in A.I. and materials stocks (chiefly gold and silver miners), the Q&A allowed me to probe Vanguard about something that has intrigued me for the past year: As a semi-retired investor who recently started a RRIF, I regard one particular Vanguard ETF as a big part of my core portfolio, along with low-volatility ETFs from BMO ETFs, and income-oriented ETFs from vendors you may see in blogs on this site.
After the Liberation Day craziness of April 2025, I became more defensive, though my Asset Allocation is not (yet) to the point the Rule of Thumb that your age should equal your Fixed Income: that would suggest in my case I should have 28% in Equities and 72% Fixed Income.
One core fund for retirees is VRIF, the Vanguard Retirement Income Fund, which is one of several funds often mentioned by the Retirement Club (see this introductory blog on the Club co-founded by blogger Dale Roberts of . ) It trades on the TSX under the ticker symbol VRIF.
The screenshot below from Vanguard’s brochure shows VRIF’s holdings of Vanguard ETFs and performance to the end of 2025.
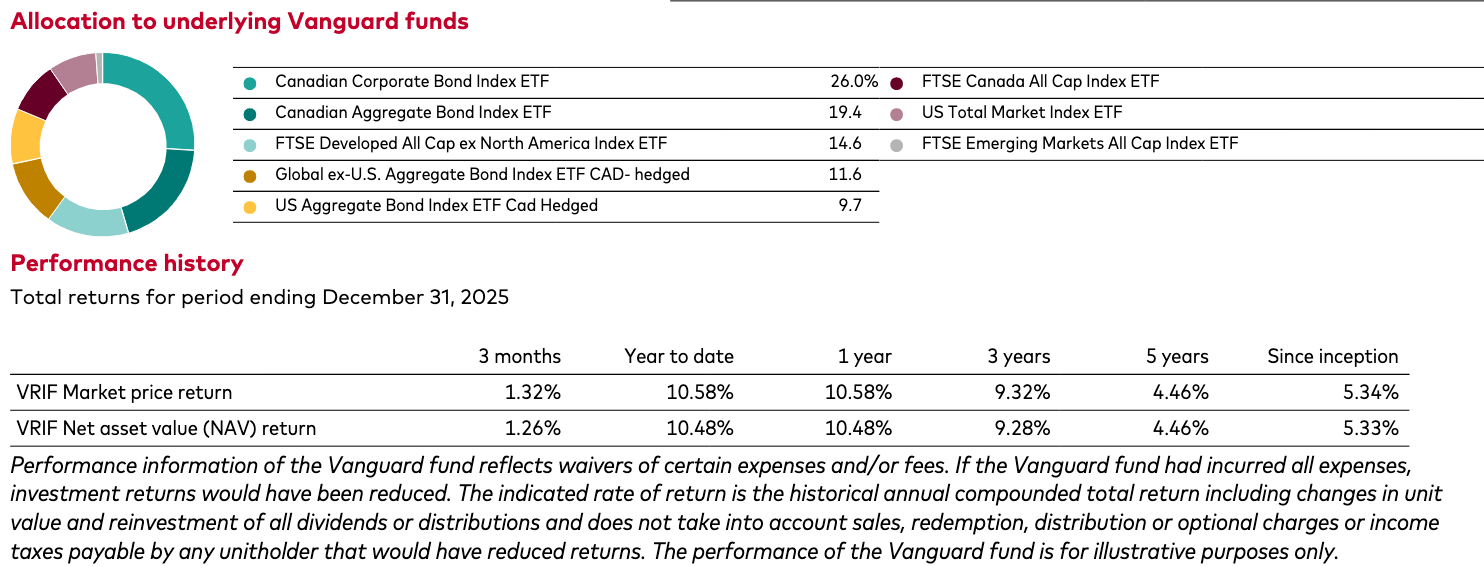
I first started a position in VRIF soon after its launch in 2020. At the time, its Asset Allocation seemed to be around 50% stocks to 50% bonds, spread around all geographies in the normal proportions.
However, as 2025 proceeded I noticed that VRIF had begun steadily to cut back on its equity exposure and raise its Fixed Income, almost to the point of 30/70. I’ve also noticed various YouTube videos from Vanguard’s U.S. parent that suggest similar caution: a cutting back from the big US growth mega cap stocks and a move more to other developed and emerging economies around the world.
If you read the VRIF launch news release, it emphasizes the objective is to provide income-seeking investors with a “targeted 4% annual payout.” That happens to be in line with William Bengen’s famous 4% Rule, which is “fine with me,” as I quipped at the media briefing.
In response to my query, Vanguard Canada spokesman Matthew Gierasimczuk said VRIF’s asset allocation varies over time” but the goal is the targeted 4% Return: Vanguard sees a “more optimistic outlook on bonds and Fixed Income: better to lock in without risk of equities.”

Then Kevin Khang, Vanguard’s head of global economic research [pictured left] reiterated that the ETF seeks to fund a “certain level of payout: bonds in our view can achieve the desired certain level of payout” and “the US stock market is pretty expensive for obvious reasons: the US is reasonably valued and bonds are very normally valued; which is a new thing.” From 2009 to 2022, since the Great Financial Crisis, bonds in general didn’t pay much, which upset people in 2022-223 when rates went up but now they are reasonably valued: relative to inflation they are paying a decent Real Return.”
Here’s the sector weightings for VRIF at the end of 2025:
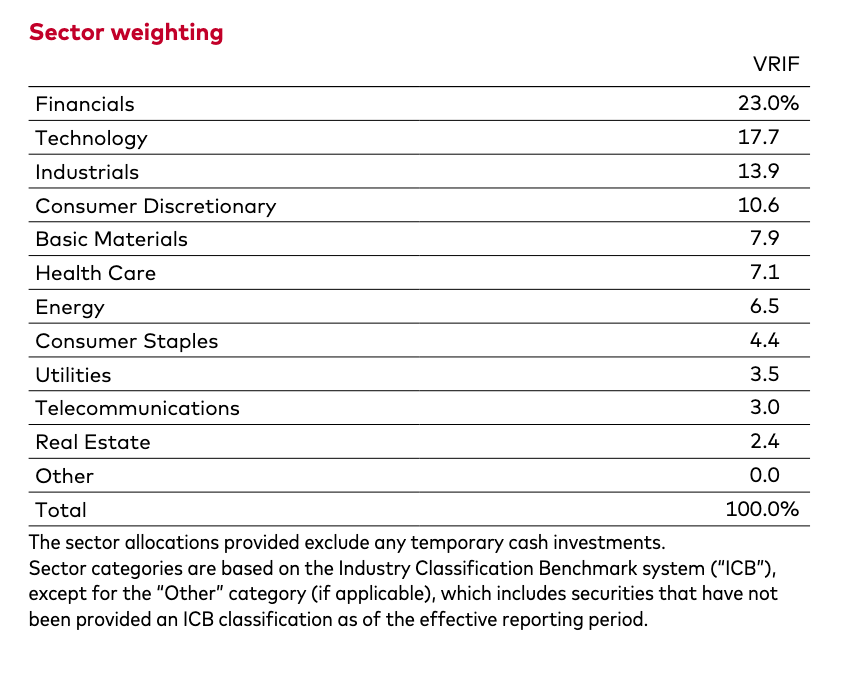
Vanguard rates its volatility as “low.” Notice the weightings of certain sectors often overweighted in pure low-volatility ETFs (like those from BMO and Harvest): Health Care, Consumer Staples and Utilities. As you can see above, the weightings in more volatile sectors like Technology and Financials is much higher.
For the MoneySense column I was subsequently referred to Head of Product for Vanguard Canada, Aime Bwakira. The rationale for VRIF’s high fixed-income exposure appears to be one of not taking more risk than you need to take, a stance which is apt for the retirees VRIF caters to. Bwakira confirmed Vanguard “has been leaning more heavily toward bonds — particularly higher quality and corporate bonds — than in past years while staying within its equity guardrails” of a minimum 30% and maximum 60%. This positioning “reflects the current environment and the results of our capital markets projections.”
3 reasons Vanguard is boosting Fixed Income in VRIF
The rationale is three-fold:
First is higher interest rates. Bonds — especially corporate bonds — are paying more than they did for many years post the 20008 Great Financial Crisis (GFC): “This makes them well‑suited to support VRIF’s 4% income target without taking on unnecessary stock-market risk. VRIF includes corporate bond exposure specifically to help enhance yield for investors.
Second, given today’s market outlook, the fund’s model has shifted toward fixed income because bonds “currently provide a more favourable balance of expected return and risk.” I was also referred to Vanguard’s current VCMM 10-year projections (VCMM = Vanguard Capital Markets Model) for various asset classes. It’s also published in the US for US investors Vanguard Capital Markets Model® forecasts | Vanguard.
Dated January 22, 2026, the document states that “Even at current stretched valuations, rising earnings growth could provide momentum for stocks in the near term. However, our conviction is growing stronger that long-term prospects for U.S. equities are subdued. Our model anticipates annualized returns of about 3.9% to 5.9% over the next 10 years.” It adds that “Our muted long-term return projection for U.S. equities is entirely consistent with our more bullish prospects for an AI-led U.S. economic boom.”
The third and most important point raised by Bwakira is that “a higher allocation to bonds helps VRIF deliver reliable cash flows, which is central to its mandate. Because income needs don’t disappear during market volatility, VRIF prioritizes stability and sustainability in its payout. VRIF aims to maintain the value of an investor’s initial investment over the long term. Tilting toward bonds during periods of elevated equity market uncertainty helps protect investors from large drawdowns while still supporting the payout.”
VRIF is one popular source of Retiree income at the new Retirement Club
This common-sense caution has not gone unnoticed by Canadian retirees seeking stable income. VRIF is a well-regarded ETF members of the Retirement Club, founded by Cutthecrapinvesting blogger Dale Roberts and partner Brent Schmidt. One of the club’s monthly Zoom presentations in the autumn of 2025 highlighted VRIF among several other income sources for retirees. Roberts has long championed VRIF, as in this blog on his site originally written after the launch, and subsequently updated: most recently in this version. Continue Reading…