I see the bad moon a-risin’
I see trouble on the way
I see earthquakes and lightnin’
I see bad times today
Don’t go around tonight Well it’s bound to take your life There’s a bad moon on the rise
Creedence Clearwater Revival
The Curious Case of Missing Inflation
Image by Shutterstock/Outcome
Prior to the global financial crisis of 2008, if you had asked me what would happen if the Fed and other central banks slashed rates to zero and then left them there for over a decade, I would have told you that it wouldn’t be long before the world faced a serious inflation problem. I would have been dead wrong!
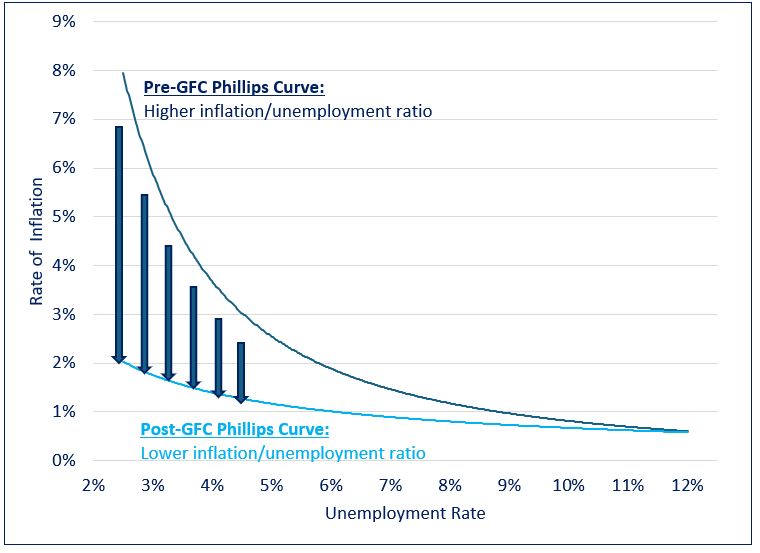
The Phillips curve is an economic concept developed by A. W. Phillips that describes the relationship between inflation and unemployment. The theory holds that there is an inverse tradeoff between the two variables. All else being equal, lower unemployment leads to higher inflation, while higher unemployment is associated with lower inflation.
Phillips’ theory proved largely resilient for most of the postwar era. However, a notable exception occurred in the years following the global financial crisis (GFC). From 2009 to 2021, despite unprecedented amounts of monetary and fiscal stimulus and record low unemployment, global prices remained unexpectedly subdued.
The Evolution of the Phillips Curve
As the chart above illustrates, in the years following the GFC the Phillips curve seemed to have shifted downward. This change allowed global economies to sustain low levels of unemployment that historically would have been accompanied by runaway inflation.
The classic unemployment vs. inflation tradeoff seemed to have vanished, leaving central bankers in the enviable position of being able to leave rates at uber stimulative levels for an extended period without spurring runaway inflation. This dynamic remained in place until 2021, when the rubber of unprecedented quantities of monetary and fiscal stimulus met the road of Covid-related supply-chain disruptions. This combination brought an abrupt end to the disinflation party of the past decade, causing central banks to raise rates at a blistering pace the likes of which had not been seen since the Volcker era of the 1980s.
Declining Interest Rates: How do love thee?
The long-term effects of low inflation and record low rates on asset prices cannot be overstated. On the earnings front, low rates make it easier for consumers to borrow money for purchases, thereby increasing companies’ sales volumes and revenues. They also enhance companies’ profitability by lowering their cost of capital and making it easier for them to invest in facilities, equipment, and inventory. Lastly, higher asset prices create a virtuous cycle: they cause a wealth effect where people feel richer and more willing to spend, thereby further spurring company profits and even higher asset prices. Continue Reading…
Stock market volatility can and will happen, which can really spook many investors.
To help with that, should you use an all-weather portfolio for changing market conditions?
Would an all-weather portfolio be best long-term?
How would I build an all-weather portfolio using Canadian ETFs?
Read on and find out our take, including the pros and cons of this all-weather investing approach.
The portfolio is designed for all seasons
If you prefer a more passive approach to investing, building an all-weather portfolio may be right for you. While this portfolio is designed to perform well during all seasons of the market, from an economic boom or bust and the messy stuff in between, we’ll see below that this approach is not without some flaws and drawbacks – just like any investing approach. Further, you could be missing out on some important aspects or assets for investing entirely.
Understanding how an all-weather portfolio works can help you to decide if this path could be right for you, or even if a blended all-weather approach could make much more sense.
What Is an All-Weather Portfolio?
Just as the name sounds, an all-weather portfolio is a portfolio that’s built to do well, regardless of changing market conditions.
This investing approach was popularized by Ray Dalio, a billionaire investor and founder of Bridgewater Associates, the largest hedge fund in the world. At the time of this post, Bridgewater currently manages over $140 billion in assets.
(FYI – this sounds very impressive of course, but we don’t invest in hedge funds and neither should you!)
Dalio’s all-weather philosophy is largely this:
Diversify your investments, hold specific asset classes in certain allocations, such that the portfolio can perform consistently throughout most economic conditions.
This includes periods of increasing volatility, rising inflation, and more. More specifically, this portfolio strategy is designed to help investors ride out four specific types of events:
Inflationary periods (rising prices)
Deflationary periods (falling prices)
Rising markets (bull/booming markets)
Falling markets (bear/busting markets)
How an All-Weather Portfolio Works
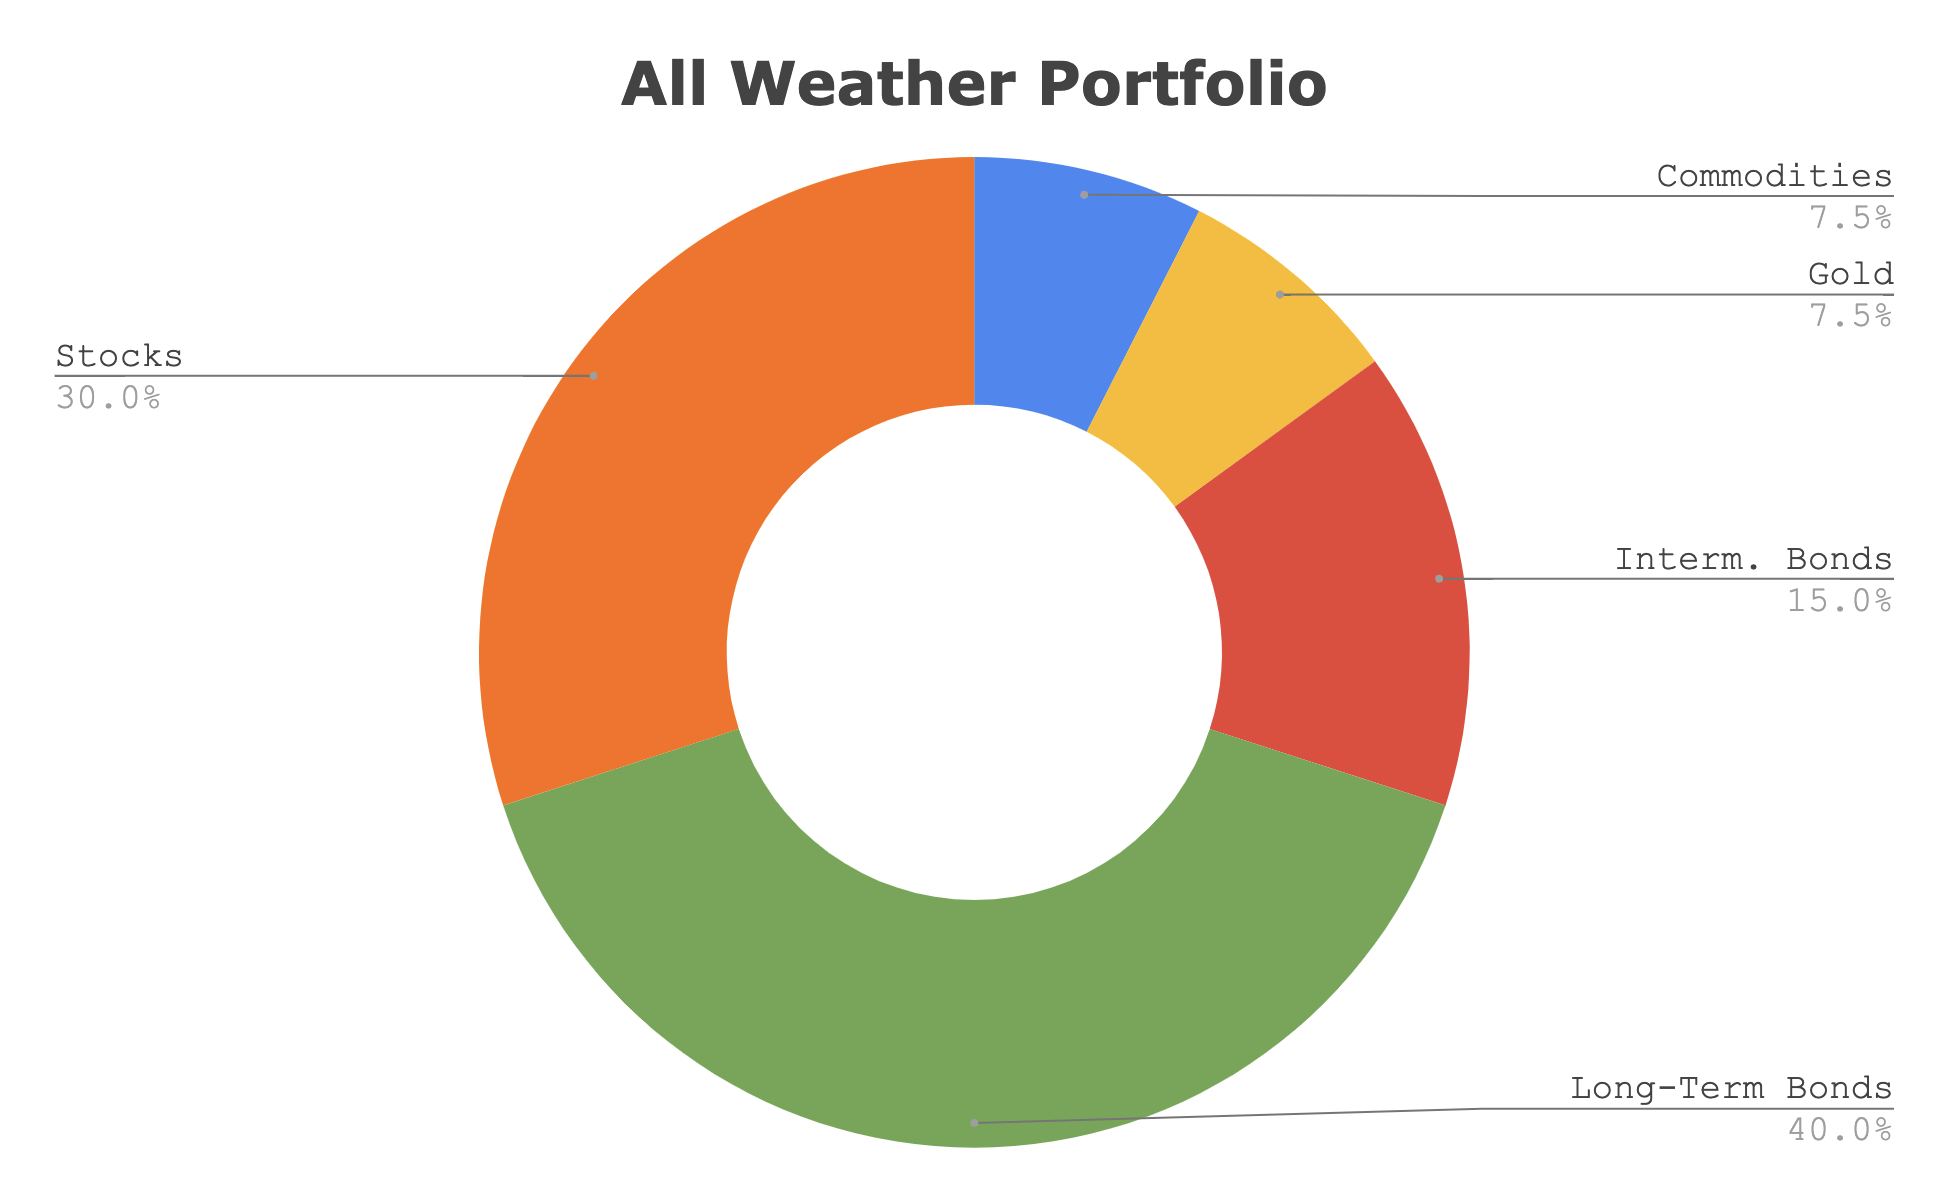
Based on back-testing, essentially Dalio and his Bridgewater team came up with a model after studying the relationship between asset class performance and changing market environments. The result of this relationship crystallized the following asset class allocation that would investors to benefit whether the market is moving up or down or sideways.
Here is the asset class breakdown:
We’ll provide more detailed funds to mimic this portfolio in a bit.
One thing you’ll realize from the portfolio above is the all-weather portfolio takes a much different approach than age-based allocations (i.e., more bonds as you get older in your portfolio), the traditional 60/40 balanced portfolio, or other popular couch potato approaches. It essentially ignores an investor’s personal need for changing risk appetite. A drawback we’ll discuss more in a bit.
The theory of the All-Weather Portfolio is that:
The equity portion will thrive in bull markets.
Commodities and gold should support the portfolio for inflation.
Bonds will help investors when stock market growth is suffering…
Here are some of the ways ETFs can be used strategically to help you sleep better at night.
Image courtesy BMO ETFs/Getty Images
By Erin Allen, VP, Online Distribution, BMO ETFs
(Sponsor Blog)
Volatility is often seen as the price of admission for achieving investment returns, but too much of it can feel like paying a hefty fee for a ride on an intense roller coaster, only to find yourself feeling queasy by the end and unable to enjoy the rest of the amusement park.
If the recent stock market turbulence in early August has left you contemplating panic selling, take a moment to breathe. Market corrections are a normal and healthy aspect of investing, and your portfolio doesn’t have to experience such dramatic ups and downs.
Why? Well, various defensively oriented ETFs can offer strategic ways to manage and mitigate risk, helping you stay the course and remain invested through the market’s inevitable fluctuations. Here are some ideas featuring BMO ‘s ETFs lineup:
Low-volatility ETFs
Imagine the broad market, such as the S&P 500 index, as a vast sea where the waves represent market volatility, and your investment portfolio is your boat navigating these waters.
How your boat responds to these waves is dictated by its beta, a measure that indicates both the direction and magnitude of your portfolio’s fluctuations relative to the market.
To put it simply, if the market’s “waves” have a beta of 1, and your portfolio also has a beta of 1, this means your portfolio will typically move in sync with the market, rising and falling to the same degree.
Now, consider if your boat were lighter and more susceptible to the waves, symbolized by a beta of two. In this scenario, your portfolio would be expected to swing twice as much as the market: more pronounced highs and lows.
Conversely, imagine your boat is a sturdy cargo ship with a beta of 0.5. In this case, your portfolio would react more calmly to market waves, experiencing only half the ups and downs of the market. This stability is what low-beta stocks can offer, and they can be conveniently accessed through various ETFs.
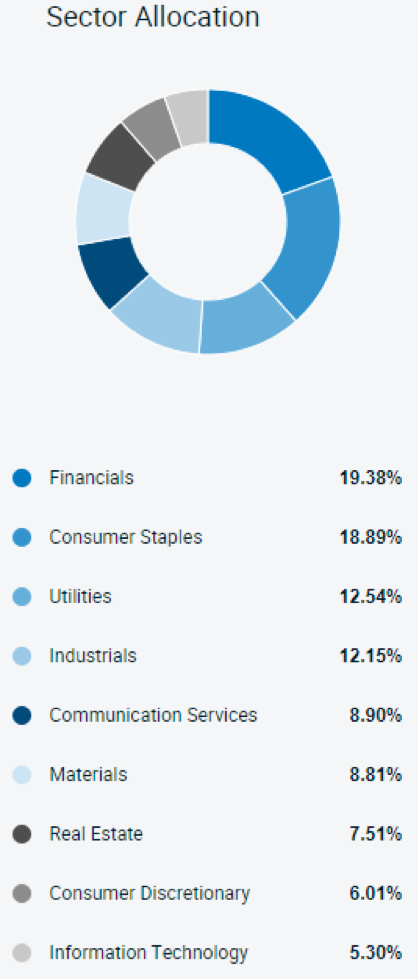
One such example is the BMO Low Volatility Canadian Equity ETF (ZLB)1, which selects Canadian stocks for their low beta. Compared to the broad Canadian market, ZLB is overweight in defensive sectors like consumer staples and utilities, which are less sensitive to economic cycles.
Holding allocations are as of August 19, 2024; sourced here1.
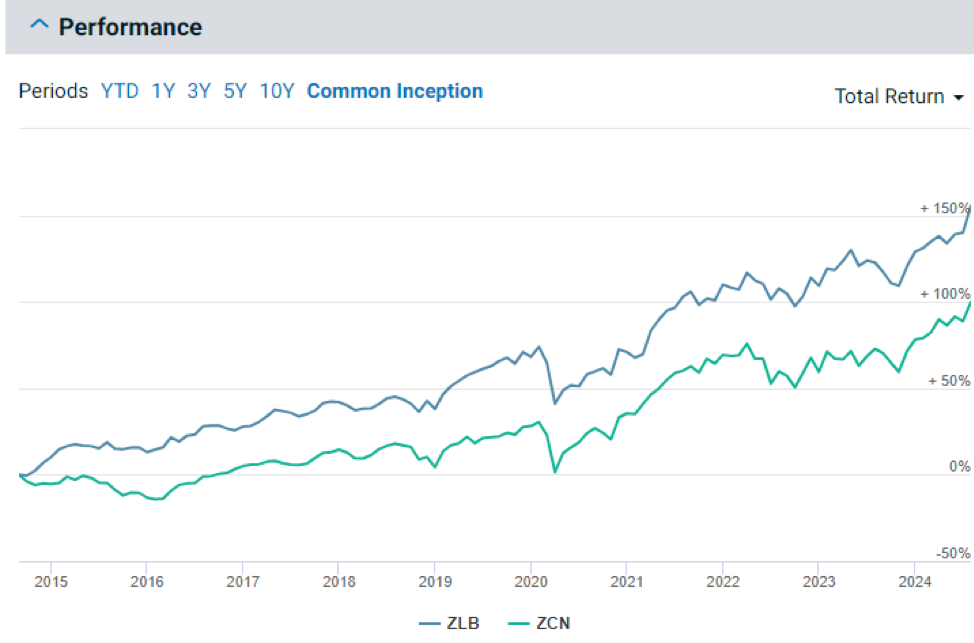
This ETF not only offers reduced volatility and smaller peak-to-trough losses compared to the BMO S&P/TSX Composite ETF (ZCN)2 but has also managed to outperform it — demonstrating that it is very much possible to achieve more return for less risk2.
While ETFs like the ZLB1 are engineered for reduced volatility through low-beta stock selection, it’s important to remember that they still hold equities.
In extreme market downturns, such as the one experienced in March 2020 during the onset of COVID-19, these funds can still be susceptible to market risk. This is pervasive and unavoidable if you’re invested in stocks; it affects virtually all equities regardless of individual company performances.
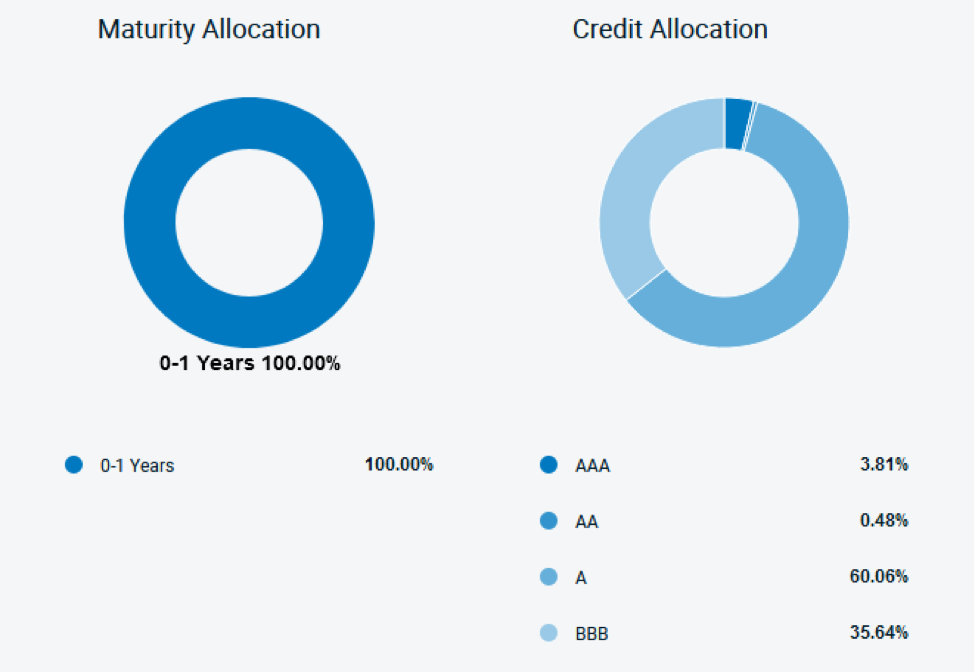
To fortify a portfolio against such downturns, diversification into other asset classes, particularly bonds, is crucial. However, not just any bonds will do — specific types, like those held by the BMO Ultra Short-Term Bond ETF (ZST)6, are particularly beneficial in these scenarios.
ZST, which pays monthly distributions, primarily selects investment-grade corporate bonds6. The focus on high credit quality, predominantly A and BBB rated bonds, is critical for reducing risk as these ratings indicate a lower likelihood of default and thus, offer greater safety during economic uncertainties.
Moreover, ZST targets bonds with less than a year until maturity6. This short duration is pivotal for those looking to minimize interest rate risk. Short-term bonds are less sensitive to changes in interest rates compared to long-term bonds, which can experience significant price drops when rates rise.
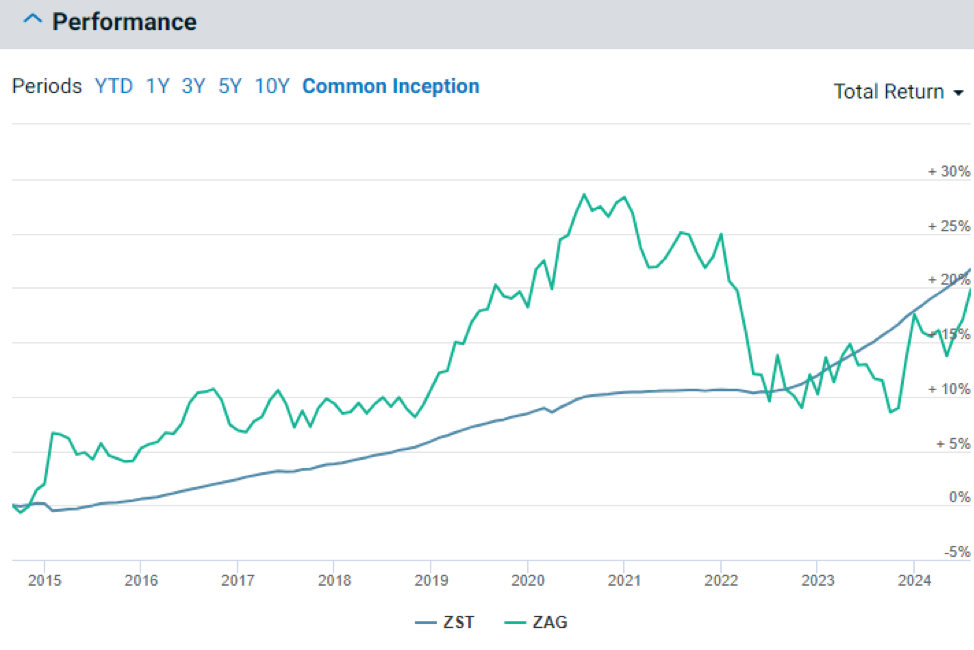
Charts as of July 31st, 2024 6
This strategic combination of high credit quality and short maturity durations7 is why, as demonstrated in the chart below, ZST has been able to steadily appreciate in value without experiencing the same level of volatility as broader aggregate bond ETFs like the BMO Aggregate Bond ETF (ZAG)8.
Buffer ETFs
If you recall the days of using training wheels when learning to ride a bike, you’ll appreciate the concept of buffer ETFs. Just as training wheels keep you from tipping over while also limiting how fast and freely you can ride, buffer ETFs aim to moderate the range of investment outcomes — both up and down.
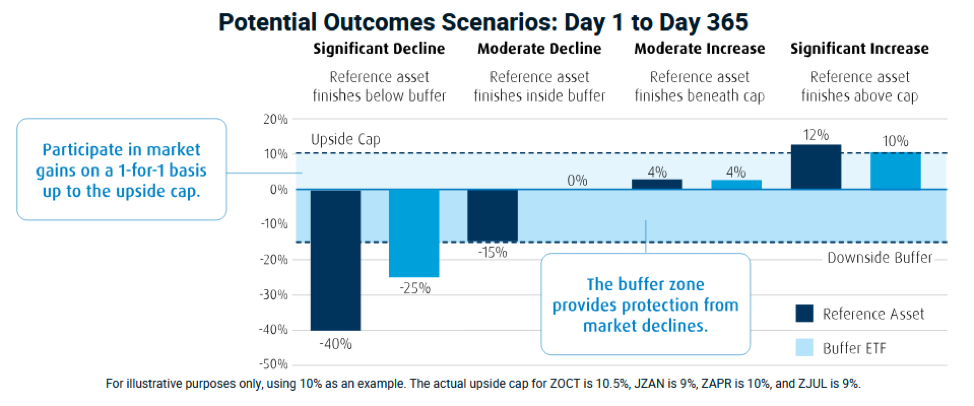
Buffer ETFs may sound complex, but the principle behind them is straightforward. These ETFs utilize options to limit your downside risk while also capping your potential upside returns.
For example, a buffer ETF might offer to limit your exposure to a maximum 10% price return of a reference asset (like the S&P 500 index) over a year while absorbing the first -15% of any losses during the same period.
If the reference asset rises, your investment increases alongside it, up to a 10% cap. However, if the reference asset declines, the ETF absorbs the first 15% of any loss. Only after this “downside buffer” is exhausted would you start to experience losses.
BMO offers four such buffer ETFs, each named according to the start month of their outcome period when the initial upside cap and buffer limits are set. These include: Continue Reading…
Before we dive into this article, let’s play a quick game: a word association game. I’ll bet you a crisp $5 bill, or a shiny loonie for the more risk averse out there, that with three chances, I can guess the first word that pops into your head. Now, it has to be the first word, so no cheating. Ready, set… the word is ‘Retirement.’
If you said ‘Retirement Income,’ ‘Retirement Savings’ or ‘Retirement Home,’ I’ll come to collect my winnings. If you said anything like ‘Travel,’ ‘Hobbies’ or ‘Exploration, then good on you; I’ll send along an IOU.
The reason I felt so confident taking that bet is because when I tell people that I work in retirement planning, 99 out of 100 times, they assume that I work in financial services. The other time, people ask about senior living. Retirement has become so synonymous with financial planning, and so associated with ‘old age,’ that they’re practically inseparable. Yet, in reality, retirement is a stage of life, not a date on the calendar, an amount in your bank account, and is certainly not a death sentence. One of our primary goals when creating our startup, RetireMint, was to reframe the national conversation around “what it means to retire,” which, at its core, requires redefining how Canadians prepare for retirement.
Now, I am not discounting the importance and necessity of a sound financial plan. After all, you are reading this in Financial Independence Hub … Yes, financial planning is the keystone of retirement preparation, as you won’t even be able to flirt with the idea of retiring without it. Yet, retirement planning must adopt a much wider definition and break free from the tethered association of solely financial planning.
Retirement should really be a time to enjoy the fruits of your hard labour: a chapter that will hopefully span decades, fuelled by leisure, exploration, discovery and meaning.
Answering the ‘what, where and how’ of everything you want to see, do and accomplish in this next chapter requires conscious preparation in areas far beyond spreadsheets and bank statements.
The industry paradigm is that you have about 8,000 days in retirement, or around 22 years. In each of those years, you will have more than 2,000 hours of new-found free time that would have been spent working throughout the majority of your life. Filling these thousands of hours with meaningful and purposeful activity is much more easily said than done.
The common approach to retirement planning (yes, we are now using the wider definition) has been to ‘punt the ball down the field’ and ‘cross that bridge when you get to it.’ Yet, we see time and time again that those who leave their lifestyle planning to their first day of retirement are the ones who have the hardest time transitioning into this next chapter.
The people who say, “I’ll never get tired of sipping Piña Coladas on a beach,” face the same fate as the ones who say “I can’t wait to golf every day.” While these may be dream activities for retirees, they ultimately see diminishing returns if they’re your only activities, because humans are funny creatures: we need meaning and variation.
Despite its innocent demeanour, retirement has some dark, inconvenient truths:
Ages 50-64, 65-84 and 85+ have the three highest suicide rates in North America, and in the last five years, we’ve seen a 38% increase in suicides among Baby Boomers.
Canadians over 65 have a divorce rate three times the national average.
Over 25% of older Canadians are socially isolated, which causes a 50% increased risk of dementia.
And, 77% of older Canadians live with at least two chronic illnesses or conditions.
It’s statistics like these that starkly highlight the importance of planning for your lifestyle, wellness and purpose, as well as the need for trusted resources to help with this planning. This was the a-ha moment that sparked our urgency to develop RetireMint.
RetireMint stemmed from empirical evidence showing that once people’s finances are at least on the right track, their primary concerns and conversations with their financial advisors shift far beyond the scope of their meetings. “What am I going to do with the grandkids?,” “Where am I going to travel?” “What happens when I lose my work insurance coverage?,” are just a few of the plethora of questions that popped up time and time again.
It’s fantastic that Canadians have this level of trust and comfort with their advisors, but the truth is that financial advisors are not equipped to answer all of these broader retirement inquiries, and they’ll be the first to admit it. It’s clear that this undue burden falls on the shoulders of financial professionals, but if not for them, who is going to provide the answers? Continue Reading…
Most investments share a fairly straightforward purpose: making money.
However, the past few years have seen an uptick in impact investing. While financial returns still play a role in this practice, the additional goal is to make a positive difference in the world.
According to Wikipedia, impact investing refers to investments “made into companies, organizations, and funds with the intention to generate a measurable, beneficial social or environmental impact alongside a financial return.” It’s about alining an investor’s beliefs and values with the allocation of capital to address social and/or environmental issues.
Impact investors want their funds to go toward causes they believe in. Historically, that’s been more easily said than done, but new technology makes it more accessible and reliable than ever. Here’s a closer look at how.
Facilitating Easier Investments
Like in all investments, Technology streamlines the trading process when impact investing. Digital platforms provide a single point where users can look through sustainable or socially conscious options to find an opportunity in less time. The same apps let people invest with a few taps of the screen, bypassing the time and intermediaries of conventional transactions.
Financial technology (fintech) also enables faster, smoother payments once users decide on an investment. Blockchain is one of the most promising innovations here, as even international transactions take just four to six seconds on these networks. Tech like this also reduces processing costs.
Such speed and cost-effectiveness mean impact investing is a more accessible practice. People who are interested but worried about the cost of third-party fees or don’t know where to begin can work around these concerns.
Providing new Impact Investing opportunities
Similarly, fintech provides new ways to get into impact investing. On a surface level, trading apps offer live news and cover deposits to make finding and jumping on unique opportunities easier. Beyond that, tech has democratized the finance industry to let people invest in causes they care about outside the conventional market system.
Peer-to-peer networks are a great example. Crowdfunding platforms like GoFundMe let anyone create a place for others to donate to or contribute directly to social impact. These opportunities are often more targeted than traditional investing. You couldn’t fund someone’s surgery on the stock market, but you can do so easily online.
Maximizing Transparency
New technologies also make it easier to ensure impact investments actually go to the causes they intend to. That’s important because 71% of young investors would turn down a significant sum of money if it meant supporting a company with a negative social or environmental impact.
Blockchain is a big difference-maker because the records are virtually impossible to change. Consequently, companies using the technology in their operations can provide proof of their sustainability or social impact. For example, diamond producer De Beers uses blockchain tracking for tamperproof assurance that its gems are ethically sourced.
The rise of digital data also means finding details on a business’s operations is more straightforward than ever. Similarly, it lets organizations provide specifics on their environmental and social efforts. This transparency helps investors determine if an opportunity aligns with their goals to boost trust in their investments.
Streamlining Impact Reports
Along similar lines, fintech can help impact investors see how their funding affects the causes they support. Many of these platforms were born online and can provide easily accessible updates on how the companies they highlight make a difference. For example, The Impact Crowd requires crowdfunding projects to submit reports at least once a year so users see what their funds do. Continue Reading…