
By Dale Roberts
Special to the Financial Independence Hub
“How much am I going to make?”
That’s likely the most reasonable question that an investor could ask. When you sign up for a savings account or GIC it’s usually the rate of return that lured you in, or got your attention. We know that many savers are ‘rate chasers’. They go from bank to bank, playing each bank against the other bank, asking for more, asking for a higher interest rate on their savings account or GIC.
I often had clients brag to me that they could get a savings account at 1.5% at so-and-so bank or credit union. I’d reply “That’s great, go for it, but I work in investments, I’m talking about earning triple or quadruple or more than that rate over time.” Of course, I would always qualify that there was the potential to earn that greater rate or return.
Did I mention that 1.5% don’t impress me much?
Of course, at this stage of the conversation I would probe the client’s savings accounts and whether or not they had a more than ample Emergency Fund. Typically, advisors will suggest that you hold 3-6 months of total spending needs in a savings account. That said, everyone knows their own personal situation and what types of emergencies that might pop up – and potentially the costs of those emergencies.
Separate short-term and long-term money
Another important practice is to separate our short-term monies and our long-term monies. Once we’re covered with that short-term emergency bucket, we move on to growth and try to make our long-term monies work real hard. You will also have day–to-day monies in a chequing or savings account.
One of the biggest mistakes Canadians make is to have too much money in “high interest” savings accounts. Guess what? That 1-2% is not going to take you to the retirement promised land. In fact, monies in a savings account are usually going backwards, it’s not making you a dime once you factor in inflation. A long term historical average for inflation is in the area of 3%. If you’re earning 2% in a savings account, you’re losing 1% spending power, each year.
Your $100,000 that you have today might feel like (or spend like) $90,000 or less in ten years. Start to extrapolate that over a few decades and the effect is greatly exaggerated. Inflation is nasty. Here’s an example that will also show my age. When I was a kid, I would take 25 cents to the movies to buy treats. With those 25 pennies I would be able to buy a pop and chips, I think I may have also been able to buy a 3-pack of gum. Yes, I also spent a lot of time in the dentist’s chair. Can you get anything for a quarter these days? I didn’t think so. Talk about losing spending power. And no, I did not grow up in the era of the Great Depression. I ‘grew up’ in the best decades of all time: the 60s and the 70s.
Only stocks can outstrip inflation
Now certainly, the 70s experienced some ‘hyper’ inflation so the effect was exaggerated. But inflation is there and it’s powerful, even in the 2.5 – 3% range.
So if savings accounts and GICs don’t match inflation, what does? Of course that’s achieved by owning companies, by way of owning their stocks. Inflation is created when prices increase, when the cost of living increases. And helping to create inflation is those companies. So you want to own big baskets of companies that are creating and usually PROFITING from those higher prices. You want in on this inflation creation. That’s why companies are usually a wonderful hedge for inflation.
Once again, there is no guarantee that companies or stock markets will keep up with inflation in every 5 or 10 year period. But over longer periods they did the trick. And in fact, they might beat inflation by 3-4-5% or more. And that is the important measure: how positive your returns might be over and above inflation. It’s about your eventual spending power.
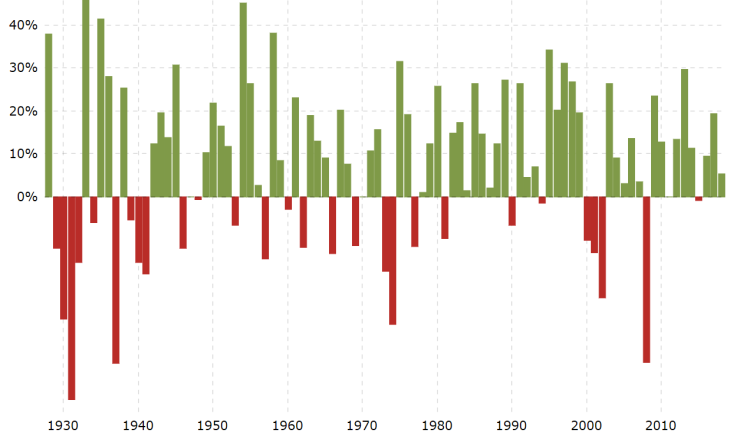
So how much might you make from the stock markets? At the top of this blog is a graphic of annual US stock market (S&P 500) annual returns from the 1930’s, courtesy of macrotrends. Also keep in mind that the US stock market is the best performing market in the developed world. The wonderful must-read site getsmarteraboutmoney.ca will show that Canadian stock market returns are slightly less.
There’s more Green than Red
Of course, that’s a crazy ride with stocks being able to increase by 50% in one year and drop by 40% in other years. But you’ll notice that there’s more green than red. In fact the ratio of positive years to negative years is almost 3 to 1, meaning there are three positive years for every down year. My fellow Seeking Alpha author Robert Allan Schwartz (who loves digging into and categorizing numbers) posted this blog that details all of the annual returns of the S&P 500, and then categorizes the returns trends. Here’s Annual Returns of the S&P 500 from 1928 to 2015. In that blog Roberts offers some wonderful insights, such as the continuous losing and winning streaks for US stocks.
Here are the streaks of consecutive down years:
streak starting in 1973 for 2 consecutive years
streak starting in 1939 for 3 consecutive years
streak starting in 2000 for 3 consecutive years
streak starting in 1929 for 4 consecutive years
Here are the streaks of consecutive up years:
streak starting in 1935 for 2 consecutive years
streak starting in 1967 for 2 consecutive years
streak starting in 1975 for 2 consecutive years
streak starting in 1954 for 3 consecutive years
streak starting in 1978 for 3 consecutive years
streak starting in 1963 for 3 consecutive years
streak starting in 1970 for 3 consecutive years
streak starting in 1942 for 4 consecutive years
streak starting in 1958 for 4 consecutive years
streak starting in 2003 for 5 consecutive years
streak starting in 1947 for 6 consecutive years
streak starting in 2009 for 7 consecutive years (this winning streak is still running from time of publication in 2015)
streak starting in 1982 for 8 consecutive years
streak starting in 1991 for 9 consecutive years
Robert calculated that the average annual rate of return from the period of study was 9.5%. That rate of return would be the CAGR or Compound Annual Growth Rate. That’s more than generous and more than enough to beat the pants off of inflation. That said, we can see that there’s no such thing as average when it comes to stock market returns. And every period is different. Some 10-year periods deliver next to nothing, and other 10-year periods deliver well above that market ‘average’. And of course the longer your investment time horizon, the closer you will get to that average.
The recent history has not been as generous as the longer term trends. From Canadian Couch Potato, here’s the returns history of Dan Bortolotti’s ETF model portfolios. We can see that the 10-year and 20-year returns for the aggressive portfolios do not even reach 7% annualized. The reason for those lesser returns is the two major market corrections of the last 20 years in 2008-2009 and 2000-2003.
 Having a very generous time horizon is an investor’s best friend; that increases the probability of positive, and generous returns. Paul Merriman studied 40 year investment periods and found …
Looking through the eyes of a young investor with 40 or more years ahead, I studied every 40-year period during that time (there were 48 of them). The worst performing period yielded a compound return of 8.9%. The best was a compound return of 12.5%.
Most can’t tolerate 100% stocks
The lesson here of course is to start early to increase your chances of grabbing those ‘average’ returns. Keep in mind that we always have to invest within our risk tolerance level. How much of a portfolio decline can you stomach? Most investors cannot invest in an all-stock portfolio. Watching a portfolio decline by 50% is not everyone’s cup of tea. That’s why most investors will need to manage the risk by way of bonds.
Here’s my article Stocks are the Unruly Kids. Bonds are the Adult in the Room. Bonds will typically lessen the amount that your portfolio will drop, but the bonds can also lessen the returns over time. That said, an investor would have historically generated generous inflation beating returns with a sensible and low fee Balanced Portfolio that includes stocks and bonds. For ideas on portfolio construction (and how easy it can be) please have a read of This is Easy Street for Canadian Investors.
Net, net, the conclusion might be that you typically need those stocks to be the growth engine of your portfolio if you need or want your investments to beat inflation. And once again, you should protect your short-term monies with guaranteed investments, then take on some risk for your longer-term monies and for the potential of those “average” 9.5% returns.
Thanks for reading. Please help your fellow Canadians who pay the highest mutual fund fees in the developed world and use those share buttons at the bottom of this blog.
Dale @ cutthecrapinvesting@gmail.com
 Dale Roberts is the Chief Disruptor at cutthecrapinvesting.com. A former ad guy and investment advisor, Dale now helps Canadians say goodbye to paying some of the highest investment fees in the world. This blog originally appeared on his site on Aug. 2, 2018 and is reproduced here with his permission.