

By Dale Roberts, cutthecrapinvesting
Special to the Financial Independence Hub
Investors around the globe are known to invest ‘too much’ of their portfolio in their home country. It is called a home bias. Canadian investors are guilty of that home bias. Many estimates suggest that Canadians hold about 60% of their portfolio assets in Canada.
Meanwhile Canadian stock markets represent only about 3% of the global total. That home bias increases portfolio concentration risk (in one country and in just a few sectors). There has also been a cost; lower returns due to the underperformance of the Canadian market vs the U.S. market and at times the International developed markets. It is an important consideration. What is the cost or your Canadian home bias?
As a backgrounder, in 2019 I suggested that you say goodbye to your Canadian home bias.
I recently posed the question on Twitter:
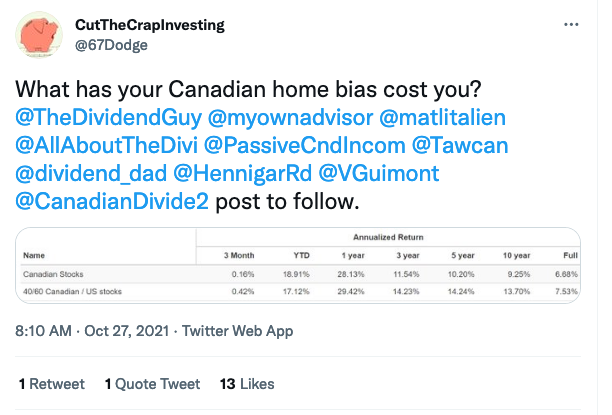
Please feel free to jump on that tweet as well and offer your home bias. Don’t be shy, we are all guilty, for the most part. If you read through that thread you’ll see that investors offered that they were largely overweight Canada. Most are holding 50% to 70% Canadian stocks.
From the table in that tweet, you can see the drastic underperformance of Canadian stocks vs U.S. stocks over the last 3-, 5-, 10-years or more.
Canadian vs U.S. stocks
And here’s the returns comparison in chart form. The charts and tables are courtesy of Portfolio Visualizer.

And the returns over various time frames, in table format.

For the above comparison, we use the TSX 60 ETF, ticker XIU that you’ll find suggested for core Canadian stocks on the ETF Model Portfolio page.
It appears that there may have been no home bias opportunity cost if you had been invested from the year 2000. Keep in mind that is a static start date measuring the investments (with dividend reinvestment) from the year 2000. The picture will change when we start adding monies ($1,000 per month) on a regular basis.

There is then a meaningful outperformance for the U.S. stocks.

Incredibly, the U.S. stock portfolio generated 46% more money to create retirement income. The TWRR stands for time weighted returns. MWRR refers to the money weighted returns, taking into account the effect of the regular contributions.
The above chart simply shows the outperformance of U.S. stocks vs Canadian stocks. That’s not to suggest that an investor should go all-in on U.S. stocks — though U.S. investors are also known to suffer from an extreme case of investor home bias.
We should not forget the lost decade for U.S. stocks. That was a period when U.S. stocks delivered no real return (inflation adjusted) for a decade or more. And that period begins at the start date for our above charts.
The home bias is of consideration for Canadians, Americans and investors around the globe.
What’s the right mix?
I don’t think you have to be perfect in this regard. And perhaps there is no perfect geographic allocation. But we certainly want a nice mix of Canadian, U.S. and International stocks. We’ll usually add bonds as well when we enter the retirement risk zone, and also in retirement.
U.S. markets certainly fill the holes of the Canadian stock market. And the U.S. multi-nationals that dominate the S&P 500 do offer significant international exposure. That said, an investor should seek greater diversification by way of international developed and developing nations outside of North America.
In the Advanced Spud (couch potato portfolio) section for MoneySense, I offered that investors might seek equal representation from developed and developing markets. There are favourable growth patterns and favourable demographics within the developing markets. As they say: demographics is destiny.
As always, this is not advice, but ideas for consideration.
Global stocks vs U.S. stocks
Here’s global stocks (the rest of the developed world) vs the U.S. market from 1996.


We see global stocks outperforming towards the end of the financial crisis (2008-2009) and then the U.S. market takes over.
We can also see the drastic difference in returns with regular investments. The U.S. stock market and U. S. companies continue to be global leaders with incredible growth prospects. You can’t blame investors for wanting to overweight the U.S. market.
The global cap weighted index
Many portfolio managers would suggest that the most passive investment approach would be to follow the global cap weighting index. That simply takes into account the value of each stock market relative to the total global markets. The stock markets with greater value receive a greater weight.
Here’s the current weighting by way of Vanguard’s (U.S. dollar) Global ETF – VT.

Within that global mix Canada is less than 3%

The U.S. market dominates the global markets. It has largely earned that position by way of earnings and revenue growth, but keep in mind that the global cap weighting method will reward momentum (and hence emotion and unbridled enthusiasm). That momentum ‘got it wrong’ in the late 1990s for U.S. stocks. Is the enthusiasm for U.S. stocks misplaced in 2021? Perhaps partially ‘wrong’?
Who knows? That said, we do know U.S. stocks are expensive by historical measures. Investors might curb their enthusiasm somewhat, in regards to following the global cap weighting scheme.
Recently on MoneySense I looked at the incredible growth of U.S. tech stocks.
That global ETF has delivered some very nice returns.

Here’s the global market vs Canadian stocks, from 2008. Keep in mind that VT is in U.S. dollars. A Canadian would have received a currency boost in addition to the total returns shown below.

Canadian investors might look to a Global (Ex-Canada) ETF such as XAW from iShares if they want to go that global route. You’d then add your Canadian assets, keeping home bias in mind, of course
And for us self-directed investors, we do not have to use cap-weighted ETFs or follow the cap weighted market when we create portfolios by way of individual stocks. Personally, I am paying attention to valuation.
By way of risk-adjusted returns, a 30% Canadian stock allocation appears to be the sweet spot. But of course there are tax considerations. Many Canadians do benefit from tax efficiency in taxable accounts by way of their big Canadian dividend stocks and ETFs.
You may shade your geographic allocation based on your personal goals and that master financial plan.
Know the costs, benchmark your returns
We all make ‘mistakes.’ The key is to learn from them. We can benchmark (compare) our returns against various indices. If we spot underperformance or too much risk, we can look under the hood to see what is causing the problem. We can then fix any shortcomings.
Like most Canadians I would have benefitted from greater U.S. equity exposure over the last decade. We sit in an area with US exposure that is over 50%, and we admittedly have very little direct non-North American exposure. I am working to fix those portfolio holes over time.
And as always, greater risk management might be in order beyond stocks and bonds. Have a read of the Permanent Portfolio and the greater Balanced ETF Portfolio.
You’ll see some good asset allocation ideas in the ETF portfolios of the Canadian Robo Advisors. Also, look to the portfolio models of the all-in-one asset allocation ETFs.
The Tangerine Core Portfolios equal weight Canada, U.S. and International. When they launched the Tangerine Global ETF Portfolios, they opted for that global cap weighting.
Thanks for reading. What is the cost or your Canadian home bias? We’ll see you in the comment section.
Don’t forget to follow this blog. Join us today on the home page. No charge.
Cut your fees, get some offers here …
While I do not accept monies for feature blog posts please click here on the mission and ‘how I might get paid’ disclosures. Affiliate partnerships help me pay the bills for this site. That will allow me to keep this site free of ads and easy to read.
You will also earn a break on fees by way of many of those partnership links.
I also have partnerships with several of the leading Canadian Robo Advisors such as Justwealth, BMO Smartfolio ,Wealthsimple, Nest Wealth and Questwealth from Questrade.
Consider Justwealth for RESP accounts. That is THE option in Canada.
Make your cash work a lot harder at EQ Bank. RRSP and TFSA account savings rates are at 1.25%. You’ll find some higher rates on certain GICs. They now also offer U.S. dollar accounts.
Kindly use the buttons below to share this post.
 Dale Roberts is the Chief Disruptor at cutthecrapinvesting.com. A former ad guy and investment advisor, Dale now helps Canadians say goodbye to paying some of the highest investment fees in the world. This blog originally appeared on Dale’s site on Oct. 30, 2021 and is republished on the Hub with his permission.
