
 By Penelope Graham, Zoocasa
Special to the Financial Independence Hub
Deciding whether or not to get into the real estate market? While budget, location, and home type will be among your top considerations, there’s another metric that can help inform your move: the buyers’ conditions in your desired neighbourhood.
Understanding whether you’ll be dealing with a sellers’, buyers’, or balanced market is key to crafting your offer or listing strategy. Those trying to buy a home amid tight sellers’ conditions will need to be ready to participate in bidding wars, for example, make aggressive bids, and be prepared to drop offer conditions to be competitive. Entering a buyers’ market indicates more real estate inventory and choice for buyers, and often the room to negotiate.
Sellers are also wise to take these conditions into account as listing during a relaxed market may mean adjusting pricing expectations; it could be a better idea to wait for the market to firm up before trying to sell your home.
What is a Sellers’ Market?
But what actually classifies a market as buyers’, sellers’, or balanced? A common misconception is price. However, while prolonged conditions will eventually influence home values, a buyers’ market doesn’t also indicate better affordability, and vice versa. Rather, these conditions are determined by a metric called the sales-to-new-listings ratio (SNLR).
The SNLR is calculated by dividing the number of sales by the number of new listings within a specific housing market over a period of time. It reveals how many of the homes listed for sale are selling within that time frame, and sheds insight into how competitive the market is for buyers and sellers. According to the Canadian Real Estate Association (CREA), an SNLR between 40 to 60% is considered a balanced market, with below and above that threshold indicating buyers’ and sellers’ conditions, respectively.
Getting the Bigger Picture
A great thing about looking at SNLR is you can get as local as you need to with your market assessment; a buyer or seller can understand what’s happening at the neighbourhood level, whether they’re looking for condos for sale in downtown Toronto, or Etobicoke homes for sale.
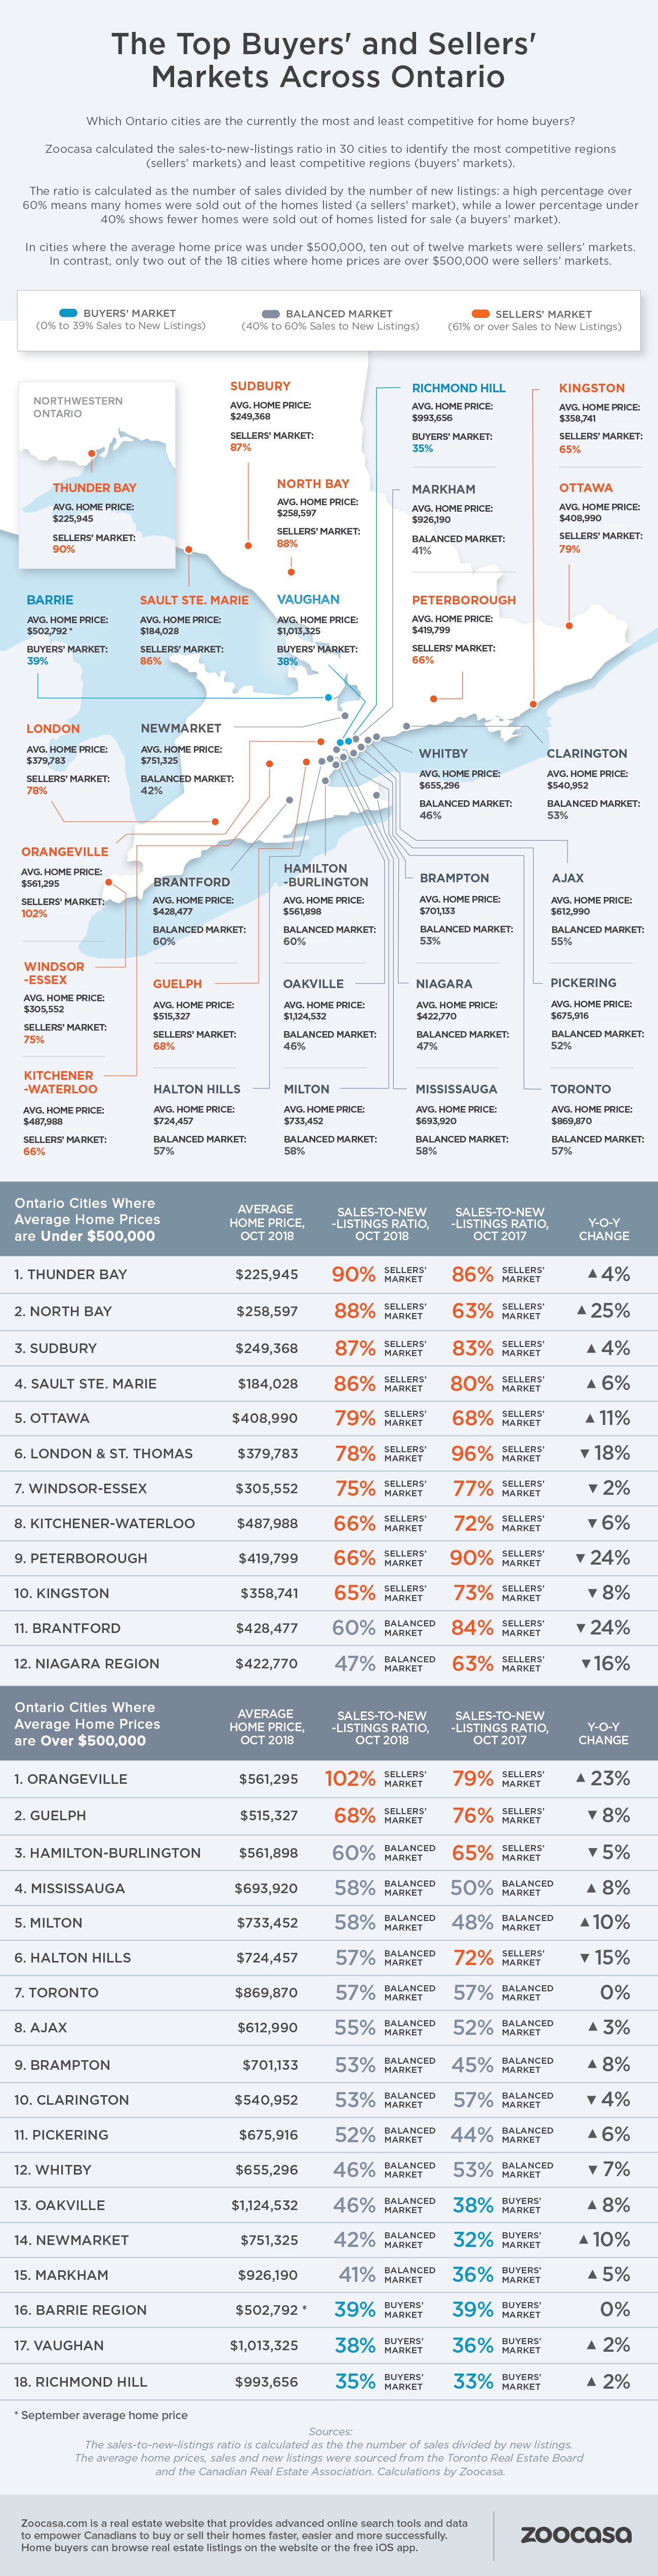
The SNLR can also be used to measure activity over larger geographic areas. At a provincial level, Ontario’s housing market remains in balanced territory, with an SNLR of 56%. However, this ranges quite widely throughout the province with some surprising results, according to recent data compiled by Zoocasa; a look at October sales and new listings numbers reveals Ontario’s most affordable markets are actually among the tightest in terms of sellers’ conditions.
Sellers’ conditions in Ontario’s most affordable markets
In markets where homes sell for less than $500,000, 10 of 12 municipalities could be considered sellers’ markets. Thunder Bay, where the average home cost $225,945 in October, boasts one of the steepest sellers’ markets in the province with an SNLR of 90%, as 205 of 227 newly listed homes sold within the month.
This is also the case in North Bay with an SNLR of 88%, as 116 of 132 homes sold at an average of $258,597 and Sudbury, where 236 of 271 homes sold, comes in third with a ratio of 87%. Sault Ste. Marie also is also within steep sellers’ territory, with a ratio of 86%, 162 of 189 homes sold, and an average home price of $184,028.
By contrast, the City of Toronto, the most expensive in the province overall, has a balanced ratio of 57%.
Check out which Ontario markets are within sellers’ buyers’, or balanced territory in the infographic that runs alongside this blog.
 Penelope Graham is the Managing Editor of Zoocasa.com, a leading real estate resource that uses full brokerage service and online tools to empower Canadians to buy or sell their home faster, easier, and more successfully.
