
By Noah Solomon
Special to Financial Independence Hub
It goes without saying that 2022 was a less than stellar year for equity investors. The MSCI All Country World Index of stocks fell 18.4%. There was virtually nowhere to hide, with equities in nearly every country and region suffering significant losses. Canadian stocks were somewhat of a standout, with the TSX Composite Index falling only 5.8% for the year.
Looking below the surface, there was an interesting development underlying these broader market movements, with value stocks far outpacing their growth counterparts. Globally, value stocks suffered a loss of 7.5% as compared to a decline of 28.6% in growth stocks. This substantial outperformance was pervasive across countries and regions, including the U.S., Europe, Asia, and emerging markets. In the U.S., 2022’s outperformance of value stocks was the highest since the collapse of the tech bubble in 2000.
These historically outsized numbers have left investors wondering whether value’s outperformance has any legs left and/or whether they should now be tilting their portfolios in favor of a relative rebound in growth stocks. As the following missive demonstrates, value stocks are far more likely than not to continue outperforming.
Context is everything: Value is the “Dog” that finally has its Day
From a contextual perspective, 2022 followed an unprecedented period of value stock underperformance.
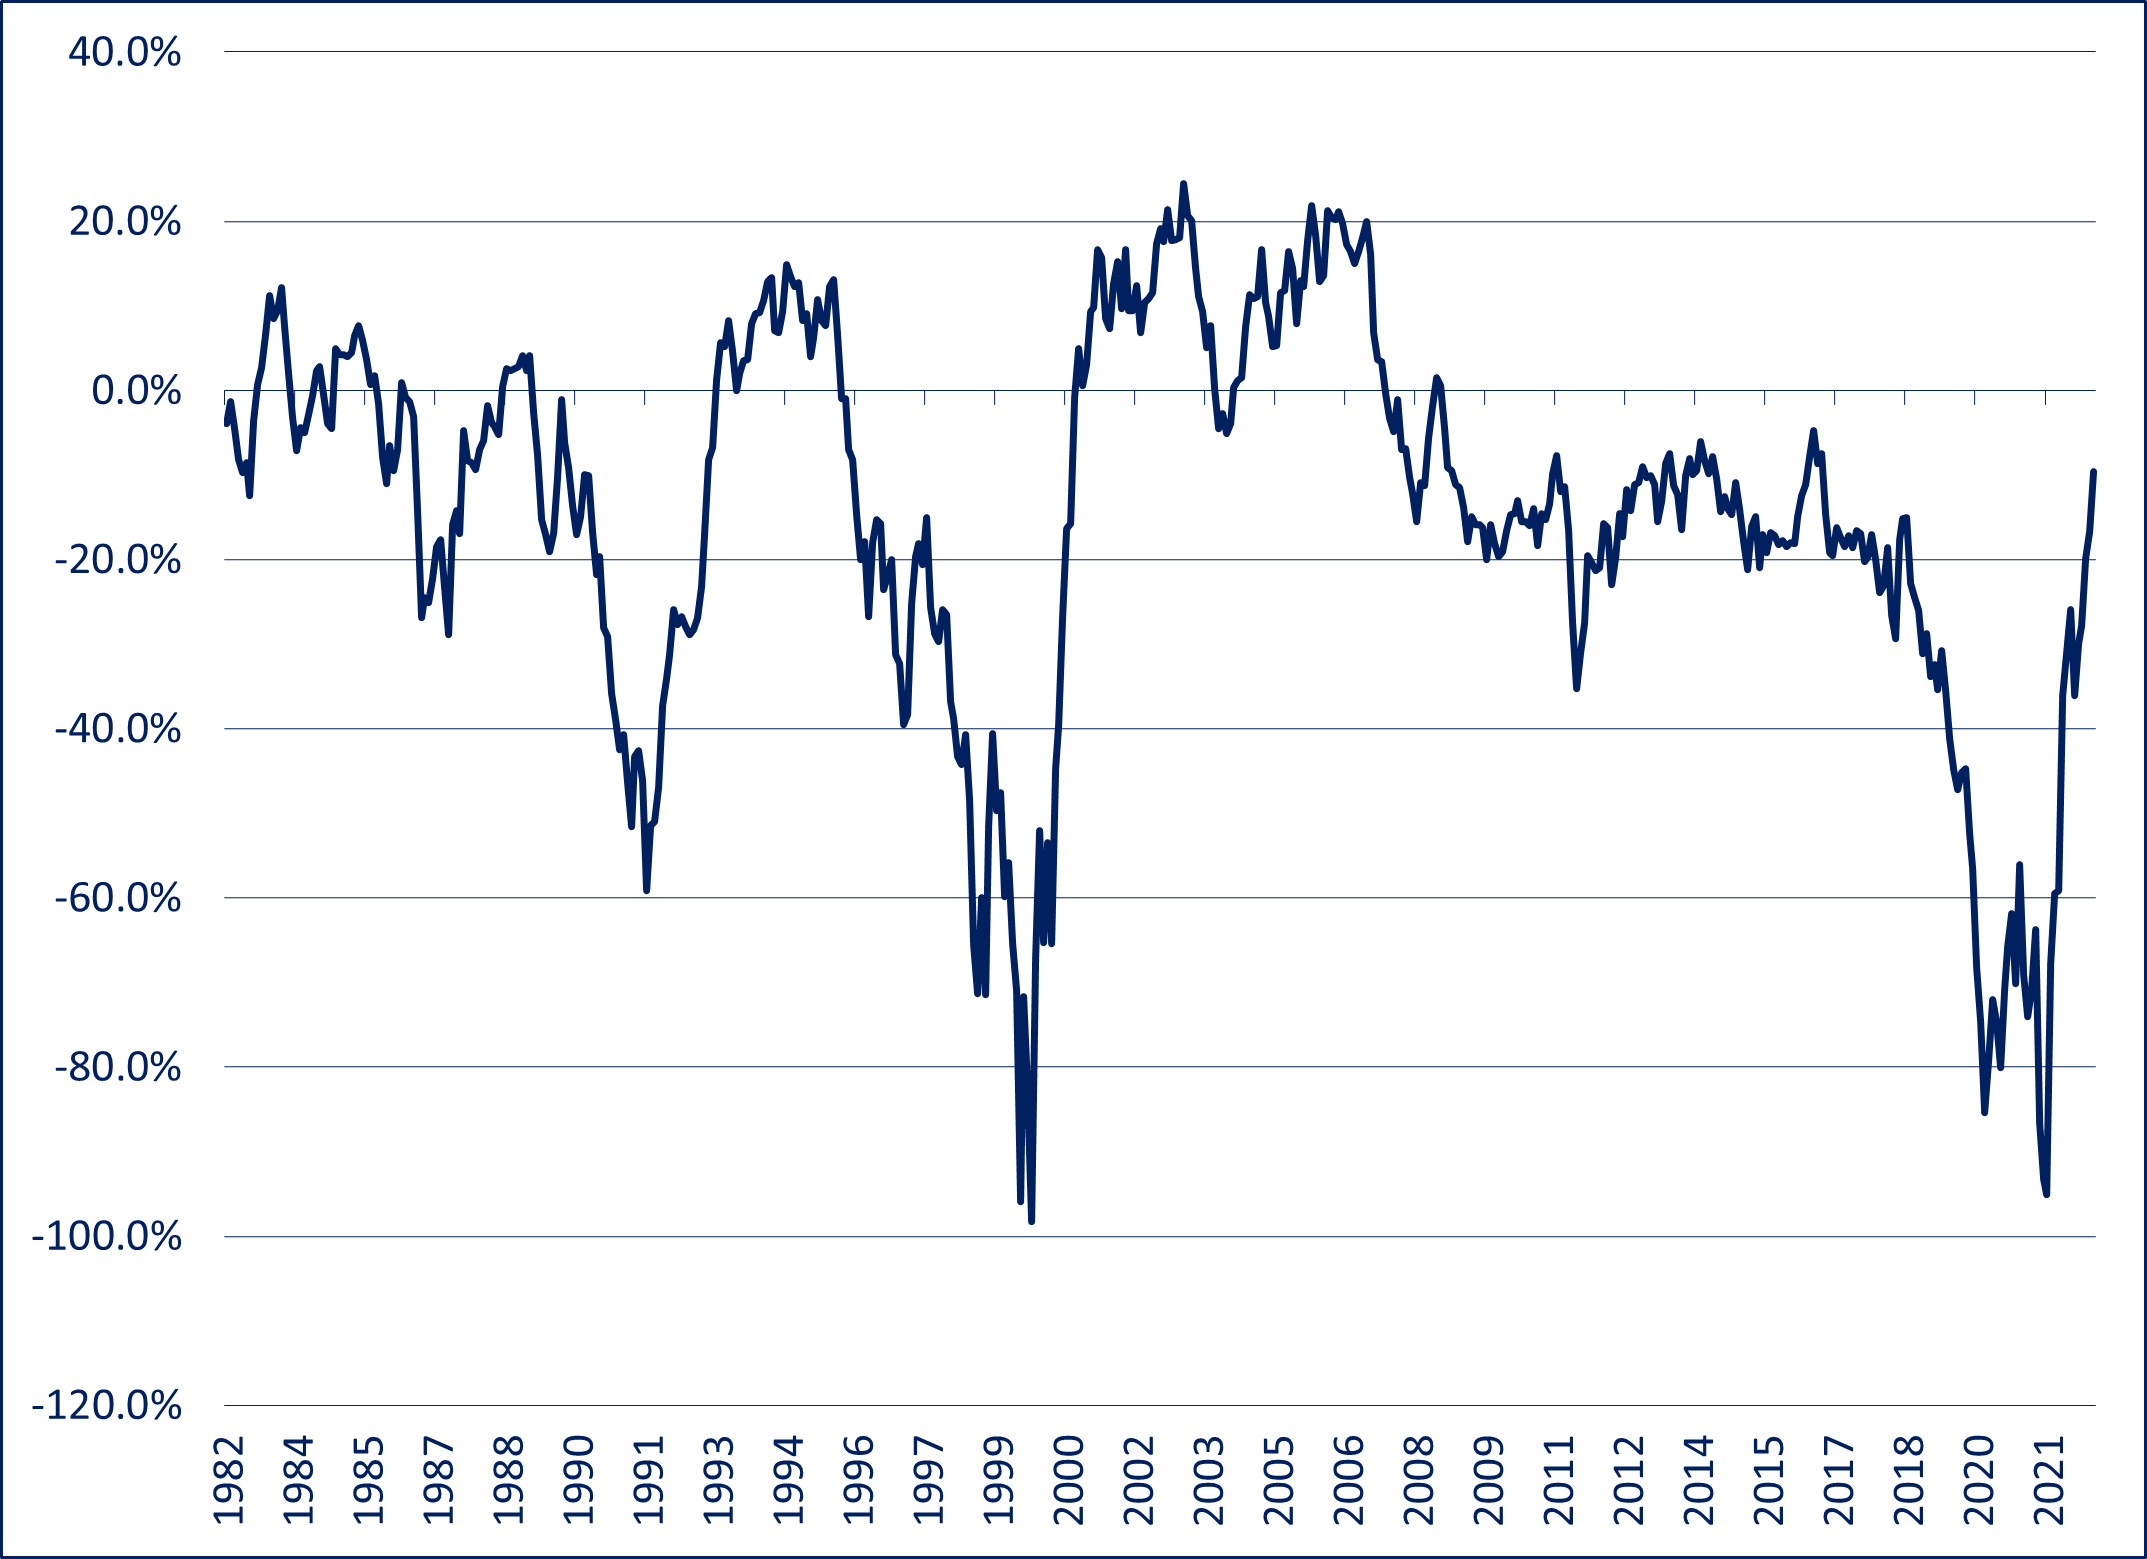
U.S Value vs. U.S. Growth Stocks – Rolling 3 Year Returns: 1982-2022
Although there have been (and will be) times when value stocks underperform their growth counterparts, the sheer scale of value’s underperformance in the several years preceding 2022 is almost without precedent in modern history. The extent of value vs. growth underperformance is matched only by that which occurred during growth stocks’ heyday in the internet bubble of the late 1990s.
Shades of Tech Bubble Insanity
The relative performance of growth vs. value stocks cannot be deemed either rational or irrational without analyzing their relative valuations. To the extent that the phenomenal winning streak of growth vs. value stocks in the runup to 2022 can be justified by commensurately superior earnings growth, it can be construed as rational. On the other hand, if the “rubber” of growth’s outperformance never met the “road” of superior profits, then at the very least you need to consider the possibility that crazy (i.e. greed, hope, etc.) had indeed entered the building.
The extreme valuations reached by many growth companies during the height of the pandemic bring to mind a warning that was issued by a market commentator during the tech bubble of the late 1990s, who stated that the prices of many stocks were “not only discounting the future, but also the hereafter.”

U.S. Value Stocks: Valuation Discount to U.S. Growth Stocks: (1995-2022)
Based on forward PE ratios, at the end of 2021 U.S. value stocks stood at a 56.3% discount to U.S. growth stocks. From a historical perspective, this discount is over double the average discount of 27.9% since 1995 and is matched only by the 56.6% discount near the height of the tech bubble in early 2000. This valuation anomaly was not just a U.S. phenomenon, with global value stocks hitting a 57.5% discount to global growth stocks, more than twice their average discount of 27.6% since 2002 and even larger than that which prevailed in early 2000 at the peak of the tech mania.
Importantly, valuation is the ultimate anchor for investments. Although the process can sometimes occur at a glacial pace, in the end there is always an inevitable pull back to fair value. Investors who ignore this fact should heed the warning of Sir John Templeton, who stated that “The four most expensive words in the English language are this time it’s different.”
Plenty of Gas left in the Value Tank: Taking the other side of Crazy
Notwithstanding value’s stellar outperformance in 2022, I am confident that it will continue to outperform over the medium-term for the simple reason that the valuation spread between value and growth stocks remains incredibly stretched.
As of the end of last year, U.S. value stocks were trading at a 45.2% discount to their growth peers, and the corresponding discount of global value equities stood at 50.4%. Assuming a reversion to their respective average historical discounts of 27.9% and 26.7%, U.S. value stands to outperform by 31.6% and global value will outperform by 46%.
The current “setup” is similar to that which existed at the height of the tech bubble in early 2000, which in retrospect was the craziest thing many investors had seen in their lifetimes. Once the bloom had come off the growth/tech rose, U.S. value stocks outperformed their growth cousins by a cumulative 54% over the next seven years.
A different approach to Value Investing
According to Wikipedia, “Value investing is an investment paradigm that involves buying securities that appear underpriced by some form of fundamental analysis.”
Although most people would concur with this general description, I do not believe that there is any official or universally accepted definition of value investing. Similarly, different value managers can vary significantly in terms of their respective approaches to security selection and portfolio construction.
Although our approach to investing in dividend-paying stocks has a clear value bias, it by no means subscribes to any conventional style. However, our machine-learning-based algorithms have produced best-in-class results. In 2022, the Outcome Canadian Equity Income strategy rose 2.2% as compared to a decline of 5.8% for the TSX Composite Index. Since its inception in October 2018, the strategy has returned 60.1% as compared to a gain of 47.6% for the TSX Composite Index. Importantly, it has achieved this outperformance with lower volatility and shallower losses in challenging markets.
Based on the success of our Canadian mandate, we adapted our unique process to large cap U.S. stocks and launched the Outcome U.S. Equity Income strategy in April of last year. Since that time, the portfolio has generated a return of 2.6% in comparison with a loss of 8.8% for the S&P 500 Index.
 Noah Solomon is Chief Investment Officer, Outcome Metric Asset Management. As CIO of Outcome, Noah has 20 years of experience in institutional investing. From 2008 to 2016, Noah was CEO and CIO of GenFund Management Inc. (formerly Genuity Fund Management), where he designed and managed data-driven, statistically-based equity funds.
Between 2002 and 2008, Noah was a proprietary trader in the equities division of Goldman Sachs, where he deployed the firm’s capital in several quantitatively-driven investment strategies. Prior to joining Goldman, Noah worked at Citibank and Lehman Brothers. Noah holds an MBA from the Wharton School of Business at the University of Pennsylvania, where he graduated as a Palmer Scholar (top 5% of graduating class). He also holds a BA from McGill University (magna cum laude). This article originally appeared in the January edition of the Outcome newsletter and is republished here with permission.
