
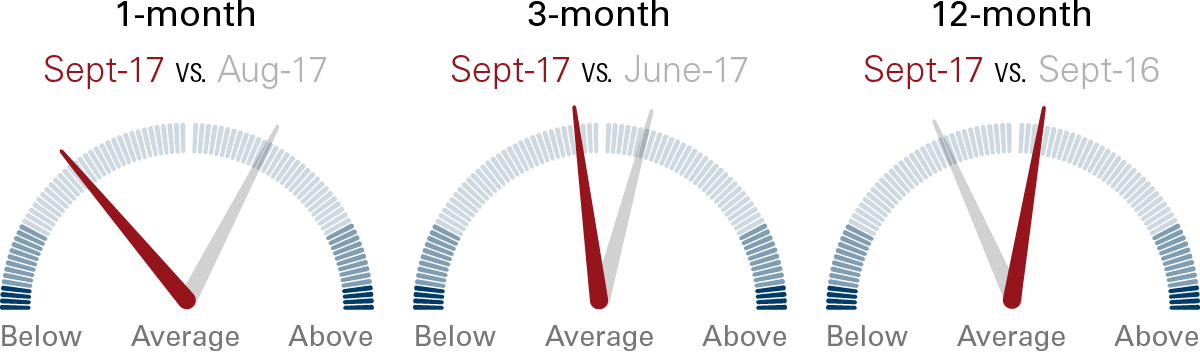
Figure 1: Vanguard’s Canadian risk speedometers, September 30, 2017
By Todd Schlanger, Senior Investment Strategist, Vanguard Canada
(Sponsor Content)
As part of Financial Literacy Month in Canada, we are proud to announce the launch of Vanguard’s Canadian risk speedometers.
These speedometers were originally designed by my colleagues in the United States to provide a factual representation of how investor risk appetite is trending today, relative to the past.
In order to generate the speedometers, we calculated net cash as a percentage of total assets under management, (in this case, within the universe of Canadian mutual funds and ETFs) into high-risk and low-risk asset categories. We then looked at the relative cash flows into high- versus low-risk asset classes, relative to history.
The end result is a risk measure that can be tracked through time and displayed in a risk speedometer index, as shown in Figure 1 over the 1-, 3-, and 12-month periods ending September 30, 2017. When risk appetite is above its historical average — such as over the 12-month period — the needle is to the right of centre, indicating higher risk appetite. When the needle is to the left of centre, risk appetite is below average. In addition to the current risk appetite readings, we also display the prior 1-, 3-, and 12-month readings for comparison.
Notes: Vanguard’s risk speedometers measure the difference between net cash flows into higher-risk asset classes and lower-risk asset classes, in this case within the universe of Canadian mutual funds and ETFs. The lighter-shaded areas represent values that are within one standard deviation of the mean, which means they occur roughly 68.2% of the time (34.1% higher and 34.1% lower). The middle shades represent readings between one and two standard deviations from the mean, occurring 27.2% of the time (13.6% higher and 13.6% lower). The dark edges represent values more than two standard deviations from the mean, occurring the remaining 4.6% of the time (2.3% higher and 2.3% lower). Speedometer values for previous periods may change from what was initially reported as the current value in prior periods because of changes made in Morningstar, Inc., data, and to the updating of the five-year average.
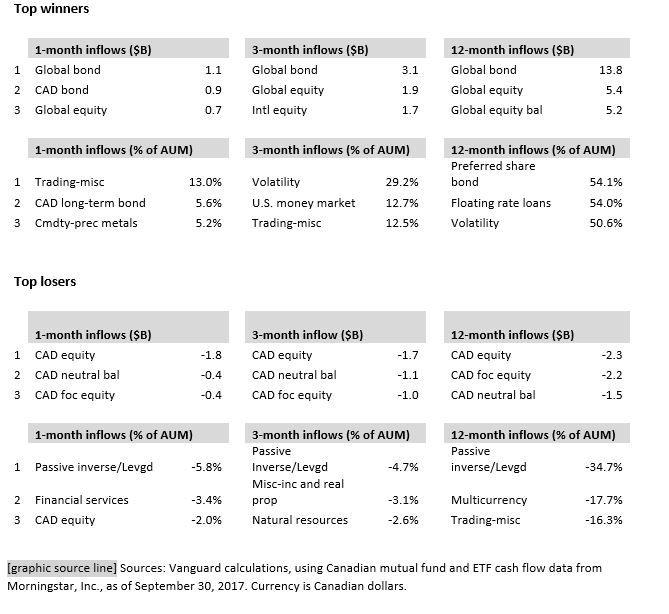
Along with the risk speedometers, we will be providing underlying asset category details (the top winners and losers in each category) in terms of net cash flows and changes in assets under management that resulted in the current risk appetite readings, as shown in Figure 2 (for the same periods, ending September 30, 2017).
Figure 2: Highest net inflows and outflows
Putting the data into perspective
While cash-flow data are widely reported, their interpretation can be more complex than conventional wisdom often suggests. Therefore, it is worth noting that our risk speedometers and net cash flow data are factual in nature and, given the diverse client groups that make up the Canadian investment industry, it can be difficult to develop firm conclusions.
Having said that, when trends emerge we will highlight them along with any themes we see from our experience and research. The current risk speedometers show appetite for risk as being either at or below its historical average in an environment where stock market returns have been above average and market volatility has been below average, with low episodes of drawdown risk.1
For example, behavioural coaching can be one of the biggest detractors from an investor’s returns. By providing a lens on investors’ evolving risk appetite, especially in bull and bear markets, we hope to provide an additional tool to help them stay the course.
The “winners” and “losers” tables provide an additional lens on investor’s asset category choices. They currently show investors have been embracing the benefits of global diversification and reducing positions in narrow slices of the market and specialty or niche products. We also see these trends as positive within the context of building well-balanced and diversified portfolios.
1 For example, Canadian and global equity market returns over the 12 months ending September 30, 2017, were an annualized +2.63% and +7.57% above their 20-year historical average with annualized volatility that was -9.67% and -6.31% lower, respectively. Source: Vanguard calculations, using data from Macrobond. Canadian equities are represented by the S&P TSX Composite Index and global equities are represented by the MSCI AC World IMI Index in CAD. Annualized return and volatility measures were computed from daily return data for the 12-month and 20-year periods ending September 30, 2017.

2150 basis points, on average, according to our research on advisor’s alpha.
 Todd Schlanger is Senior Investment Strategist for Vanguard Canada.
Important information

The views expressed in this material are based on the author's assessment as of the first publication date (November 2017), are subject to change without notice and may not represent the views and/or opinions of Vanguard Investments Canada Inc. The authors may not necessarily update or supplement their views and opinions whether as a result of new information, changing circumstances, future events or otherwise.

This material is for informational purposes only. This material is not intended to be relied upon as research, investment, or tax advice and is not an implied or express recommendation, offer or solicitation to buy or sell any security or to adopt any particular investment or portfolio strategy. Any views and opinions expressed do not take into account the particular investment objectives, needs, restrictions and circumstances of a specific investor and, thus, should not be used as the basis of any specific investment recommendation.

Please consult your financial and/or tax advisor for financial and/or tax information applicable to your specific situation.

While this information has been compiled from sources believed to be reliable, Vanguard Investments Canada Inc. does not guarantee the accuracy, completeness, timeliness or reliability of this information or any results from its use.

All investments, including those that seek to track indexes, are subject to risk, including the possible loss of principal. Diversification does not ensure a profit or protect against a loss in a declining market.

In this material, references to "Vanguard" are provided for convenience only and may refer to, where applicable, only The Vanguard Group, Inc., and/or may include its affiliates, including Vanguard Investments Canada Inc.
