
 By Noah Solomon
Special to the Financial Independence Hub
The Buffett indicator is a simple ratio that compares the market capitalization of the U.S. stock market to its GDP. Buffett himself warns that if this ratio reaches 200%, “you are playing with fire.” At its current level of approximately 234%, this indicator is higher than it has ever been, including at the peak of the dot-com bubble in the early 2000s.
The cyclically adjusted price/earnings (CAPE) ratio is a well-known metric invented by economist and Nobel Laureate Robert Shiller. The S&P 500 Index’s CAPE ratio currently stands at 36.6, which is higher than 98% of monthly readings since 1881, and more than double its 140-year average.
To be fair, the current nosebleed levels of the Buffett indicator and the CAPE ratio can be partially explained by today’s record low interest rates. Furthermore, equity markets have become increasingly dominated by technology-driven and/or software-as-a-service (SaaS) companies with above average profitability. This shift may render current valuations less comparable to those of the distant past.
Regardless of the valuation metrics you use or whichever “this time it’s different” adjustments you make, stocks today range anywhere from somewhat expensive to obscenely overvalued.
Since 2008, financial markets have benefited from an unprecedented period of low-interest rates. When the pandemic began to ravage the globe in early 2020, the Fed cut interest rates to near zero and began pumping hundreds of billions of dollars into financial markets. By purchasing Treasury bonds and government-backed mortgages, the Fed has continued to inject approximately $120 billion into the economy each month.
Leaving interest rates at levels below inflation for an extended period is like putting a giant hose in the ground – water will come up somewhere. In the case of monetary stimulus, the “water” manifests itself in rising asset prices. According to legendary investor Marty Zweig:
In today’s markets, you don’t have to look very hard to find strong evidence of Zweig’s theory, which explains why stock markets were making fresh highs during successive outbreaks of Covid-19 and spiking unemployment. It also explains why approximately two thirds of stock returns over the past decade are attributable to multiple expansion rather than earnings growth.
Those who think that the huge gains in everything from stocks to art to cryptocurrencies to real estate over the past 12 years are solely the result of economic growth and corporate ingenuity should avoid anyone selling GameStop options! The market’s dependence on low rates cannot be overestimated. Interest rates giveth and taketh away. Should the central banks succeed (or over succeed) in getting the inflation genie out of its bottle, equities could be in for a nasty ride.
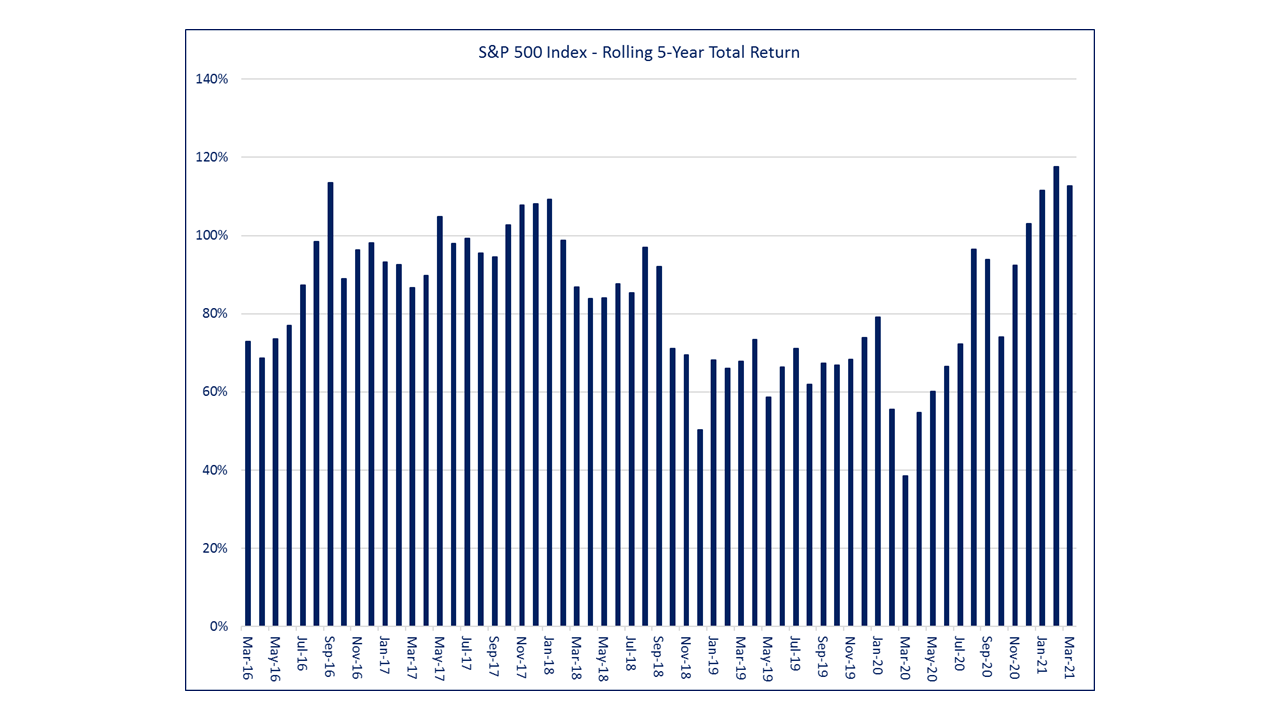
Extreme valuations are only one of the features that have historically accompanied asset bubbles and subsequent busts. Another harbinger of future misery has been accelerating gains. Prior to both the tech-wreck of the early 2000s and the global financial crisis of 2008, market returns had shifted from normal to worryingly unsustainable. Accelerating gains can be thought of as a rubber band that is being stretched further and further. The more you stretch the band, the greater the likelihood that it will snap.
As the following chart demonstrates, average equity market returns have been accelerating to the point where they are at their highest levels in five years.
Excessive speculation is another common ingredient in the recipe of historical bubbles. Whereas it’s never precisely clear what percentage of market activity is driven by short-term speculators (i.e., gamblers) as opposed to long-term investors, there are some clear signs that the lunatics are at least helping to manage (and possibly running) the asylum.
If you think information may surface that will cause people to recognize that a company is worth much more than its current value, then you would either purchase its shares or buy long-dated call options. By contrast, short-dated call options represent speculation in its purest form. Buyers of five-day options have no reasonable expectation that meaningful new information will emerge over that period – they are simply gambling.
Investors have piled into short-dated options like never before, with recent volumes running 8x higher than what they were from 2013-2016 and a whopping 4x more than levels that prevailed before the onset of Covid-19.
Unbridled investor enthusiasm has contributed to a parabolic rise the market for IPOs. With more than 447 new share offerings and over $165 billion raised, 2020 marks the best year for IPOs since the peak of the dotcom frenzy, when $167 billion in today’s dollars was raised via 547 IPOs.
Perhaps even more striking than the number and aggregate value of IPOs is their post-issuance behaviour. Shares of food delivery service DoorDash soared 86% on their first trading day. The next day, Airbnb’s newly issued shares jumped 113%, giving the company a market valuation of more than $100 billion. Neither company is profitable (although to be fair, for a long time neither was Amazon).
These surges were primarily driven by demand from individual investors rather than professional money managers. The latter largely stayed on the sidelines, stupefied by the prices being paid by smaller participants.
SPACs (special purpose acquisition companies) give promoters the ability to quickly deliver whichever flavour of the day markets are craving at any point in time, whether it be electric vehicles, artificial intelligence software, autonomous driving components, etc.
During the 12 months ending March 31, 2021, total SPAC issuance was 2.5x higher than the combined SPAC issuance over the past 25 years. While I’m not saying that some SPAC-sponsored companies won’t go on to be wildly successful, you don’t have to be Warren Buffett to figure out that there will be no shortage of investors left holding what will be nothing more than worthless lottery tickets.
Given the historically toxic combination of elevated valuations, accelerating gains, and excessive speculation, you could characterize today’s markets as clearly foaming at the mouth. Unfortunately, identifying bubbles with certainty is difficult. Even worse, it is virtually impossible to predict when they will deflate or burst.
Legendary investor Leon Cooperman recently stated that he is “a fully invested bear”. Although he suspects that the markets may be lower a year from now, he intends to remain invested and “just watch the things that would normally indicate an end.” In essence, Cooperman was emphasizing the precarious nature of today’s markets and the resulting need for flexibility.
It is this kind of flexibility which is the foundation of our Global Tactical Asset Allocation (GTAA) mandate, which uses AI and machine learning-based signals to tactically shift between more volatile, pro-growth assets such as equities and high yield bonds and less volatile, safe haven markets such as Treasuries and short-term investment grade bonds to participate in rising markets while protecting our clients from large bear market losses. Since its inception in May of 2017, the fund has delivered strong risk-adjusted returns and protected our clients from large losses during the challenging fourth quarter of 2018 and in the tumultuous markets of early 2020.
Given today’s starting point of record low interest rates and above average valuations, it is likely that average capital gains will be disappointing over the next several years. In this scenario, dividend income will represent an increasing share of total returns and dividend paying stocks will generally outperform their non-dividend paying counterparts. In such an environment, our algorithmically driven, A.I.-based Enhanced Dividend strategy is an attractive proposition. Since its inception in October 2018, the fund has returned 21.1%, outperforming the TSX Dividend Aristocrats Index by 5.7% while achieving lower volatility and drawdowns.
 Noah Solomon is Chief Investment Officer of Outcome Metric Asset Management. As CIO of Outcome, Noah has 20 years of experience in institutional investing. From 2008 to 2016, Noah was CEO and CIO of GenFund Management Inc. (formerly Genuity Fund Management), where he designed and managed data-driven, statistically-based equity funds. Between 2002 and 2008, Noah was a proprietary trader in the equities division of Goldman Sachs, where he deployed the firm’s capital in several quantitatively-driven investment strategies.
Prior to joining Goldman, Noah worked at Citibank and Lehman Brothers. Noah holds an MBA from the Wharton School of Business at the University of Pennsylvania, where he graduated as a Palmer Scholar (top 5% of graduating class). He also holds a BA from McGill University (magna cum laude).
This blog first ran in the May issue of Commentary and is republished with permission.
