Tag Archives: asset allocation

Financial industry’s forecasting is a mug’s game, especially under Trump

By John De Goey, CFP, CIM

Special to Financial Independence Hub

Around the middle of December, advisory firms and the people who work for them start putting out their retrospectives regarding the year that is just about to end and / or offer their forecast for the new year. I have long argued that forecasting is a mugs game. To the extent that I have grudgingly participated in the exercise previously, I have found it to be humbling. As such, I want to stress that what follows is not so much a forecast as it is a concern for what may – and I stress MAY – come to pass in light of what we already know about the incoming administration south of the border.

To begin, the President-elect is a criminal. He has literally been convicted of 34 felonies. This is in addition to two impeachments, various infidelities, an attempted insurrection, and the stealing of highly classified state secrets. We now have a good sense of what his cabinet will look like: assuming most of his forthcoming nominees are ultimately appointed. This is a man who is quite willing to appoint incompetent sycophants who will help him expand his ongoing criminal activity at the expense of more traditional character traits like relevant education, experience, and character. The notion of traditional public service seems to be foreign to many would-be cabinet appointees.

Will Trump manufacture a Recession?

Early in December, I was in Southern California and spoke with the founder of an AI company in Silicon Valley. He told me there is a theory making the rounds that Donald Trump intends to do something highly unconventional in his longstanding pursuit personal self-interest. The executive told me that a number of thought leaders are of the opinion that Trump intends to deliberately manufacture a recession immediately upon taking office.

Their view is that, given the experiences of both the global financial crisis and the COVID crisis, it has become apparent that when the economy is severely threatened and bailouts are required, billionaires and plutocrats end up doing very well. Meanwhile, ordinary middle-class people and those even lower on the social spectrum fall further behind.

In the aftermath of the election on November 5th, American capital markets responded favorably based on the presumption that lower taxes and less regulation would be highly stimulative and favourable for the economy. This view held sway even though the President-elect campaigned on a platform of indiscriminately-high tariffs, mass deportations, and a draconian cutting of government services via the department of government efficiency (DOGE).

There are some who fear that the promise to rein in the debt will be used as an excuse to cut back on government programs that ordinary Americans rely on. As it stands, approximately three quarters of all U.S. annual expenditures are fixed in law and allocated toward entitlements such as Medicare, Medicaid, and Social Security, as well as interest on the national debt.

Cutting US$2 trillion from the budget is simply impossible without encroaching on at least some of these programs. Stated differently, even if Trump were to cut all other programs (including the CIA in the SEC) to zero, the savings would still be less than the $2 trillion a year he pledged to cut. He will, of course, blame Joe Biden for “the mess he inherited” either way.

No fiscal Conservatives left in America

Meanwhile, the evidence shows that for over half a century, the U.S. accumulated debt has been growing under both major parties. It seems there are no fiscal conservatives left in America. Again, I stress, this is not a forecast, but rather a recounting of a narrative that several thoughtful people who live south of the border believe to be plausible. If you think wealth inequality and income inequality are a problem now, you could be in for a rude awakening if anything close to this narrative comes to pass.

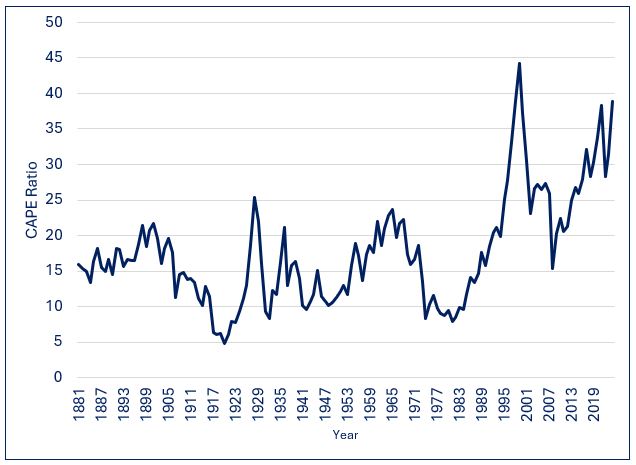
As many people know, I have long been a proponent of efficient capital markets. Any person who espouses this view believes that prices reflect all available information to the point where it is impractical to think that mispricings are sufficiently large and identifiable so as to allow people to engage in trading that would allow that person to make material profit. The American stock market clearly does not subscribe to the narrative I’ve just outlined. Of course, consensus opinions can be wrong. In this instance, perhaps more than any other in my lifetime, I actively want the consensus to be correct. Continue Reading…

Be the House, not the Chump


Free public domain CC0 photo courtesy Outcome

By Noah Solomon

Special to Financial Independence Hub

I’m just sitting on a fence
You can say I got no sense
Trying to make up my mind
Really is too horrifying
So I’m sitting on a fence

  • The Rolling Stones


Benjamin Graham and David Dodd are universally regarded as the fathers of value investing. In their 1934 book “Security Analysis” they introduced the concept of comparing stock prices with earnings smoothed across multiple years. This long-term perspective dampens the effects of expansions as well as recessions. Yale Professor and Nobel Prize winner Robert Shiller later popularized Graham and Dodd’s approach with his own version, which is referred to as the cyclically adjusted price-to-earnings (CAPE) ratio.

S&P 500 CAPE Ratio: 1881- Present

Since 1881, the CAPE ratio for U.S. equities has spent about half of the time between 10 and 20, with an average and median value of about 16. Its all-time low of 5 occurred at the end of 1920, and its high point of 45 occurred at the end of 1999 during the height of the internet bubble.

What if I told you …. ?

The following table shows average real (after inflation) annualized returns following various CAPE ranges.

S&P 500 Index: CAPE Ratio Ranges vs. Average Annualized Future Returns (1881 Present)


What is abundantly clear is that higher returns have tended to follow lower CAPE ratios, while lower returns (or losses) have tended to follow elevated CAPE levels. An investment strategy that entailed having above average exposure to stocks when CAPE levels were low, below average equity exposure when CAPE levels were high, and average allocations to stocks when CAPE levels were neither elevated not depressed would have resulted in both less severe losses in bear markets and higher returns over the long-term.

By no means does this imply that low CAPE ratios are always followed by periods of strong performance, nor does it imply that poor results are guaranteed following instances of elevated CAPE levels. That would be too easy!

S&P 500 Index: Lowest CAPE Ratios vs. Future Real Returns (1881 – Present)   


S&P 500 Index: Highest CAPE Ratios vs. Future Real Returns (1881 – Present) 


Looking at the performance of stocks following extreme CAPE levels, it is clear that valuation is best used as a strategic guide rather than as a short-term timing tool. It is most useful on a time scale of several years rather than a shorter-term timing tool.

  • Although there have been instances where low CAPE levels have been followed by weak performance over the next 1-3 years, there have been no instances in which average annualized returns over the next 5-10 years have not been either average or above average. While it sometimes takes time for the proverbial party to get started when CAPE levels hit abnormally depressed levels, markets have without exception performed admirably over the medium to long-term.
  • Similarly, although there have been instances where high CAPE levels have been followed by strong performance over the next 1-3 years, there have been no instances in which average annualized returns over the next 5-10 years have not been either below average or negative. Whenever CAPE levels have been extremely elevated, it has only been a matter of time before the valuation reaper exacted its toll on markets. This brings to mind the following quote from Buffett:

“After a heady experience of that kind, normally sensible people drift into behavior akin to that of Cinderella at the ball. They know that overstaying the festivities — that is, continuing to speculate in companies that have gigantic valuations relative to the cash they are likely to generate in the future — will eventually bring on pumpkins and mice. But they nevertheless hate to miss a single minute of what is one helluva party. Therefore, the giddy participants all plan to leave just seconds before midnight. There’s a problem, though: They are dancing in a room in which the clocks have no hands.”

Be the House, Not the Chump

There have been (and inevitably will be) times when equities post strong returns for a limited time following elevated CAPE levels and instances where stocks post temporarily weak results following depressed CAPE levels.

However, successful investing is largely about playing the odds. If you were at a casino, wouldn’t you prefer to be the house rather than the chump on the other side of the table? Although chumps occasionally get lucky, this doesn’t change the fact that the odds aren’t in their favour and that they are playing a losing game. Over the long-term, investors who refrain from reducing their equity exposure when CAPE levels are elevated and don’t increase their allocations to stocks when CAPE levels are depressed will achieve satisfactory returns over extended periods. That being said, I sure wouldn’t recommend such a static approach for the simple reason that it involves suffering severe setbacks in bear markets and leaving a lot of money on the table over the long-term.

Given the historically powerful relationship between starting CAPE levels and subsequent returns, what if I told you that the CAPE ratio currently stands at 38, putting it at the top 98th percentile of all year-end observations going back over 150 years, and the top 96th percentile over the past 50 years? Presumably you would at the very least consider taking a more cautious stance on U.S. stocks.

Let’s Pretend ….

Let’s pretend that you knew nothing about the historical relationship between CAPE levels and subsequent returns.  A combination of behavioural biases, speculative fervour, and FOMO (fear of missing out) might lead you to adopt an “if it isn’t broken, don’t fix it” stance of inertia.

Recency bias can give people a false sense of confidence that what has occurred in the recent past is “normal” and is therefore likely to continue in the future. Moreover, the strong returns which have occurred since the global financial crisis can exacerbate FOMO, thereby prompting investors to stay at the party (and perhaps even to imbibe more intensely by increasing their equity exposure). Lastly, the potential of innovative technologies such as AI to revolutionize businesses can capture investors’ imaginations and incite euphoria to the point where they believe that there is no price that is too high to pay for the unlimited profit potential of the “shiny new toy.”

Standing at the Crossroads

So here we stand at a crossroads, caught between the weight of history and the possibility that this time it may truly be different. What is an investor to do? One can never be 100% sure. The “right” answer will only be known in hindsight once it becomes a matter of record, at which point it will be too late for investors who get caught on the wrong side of the fence. Continue Reading…

Hello 2025: Investing in the Zero Visibility Age


By Dale Roberts, cutthecrapinvesting

Special to Financial Independence Hub

While there is only one trading day left in 2024, it is clear that it is another year that fooled everyone. The year 2023 fooled economists and market prognosticators with U.S. stocks up over 26% in U.S. Dollars (and up more in Canadian Dollars). 2024 is shaping up as a carbon copy in performance and in big swing and miss predictions. Canadian stocks are looking to finish the year up over 20%. Good luck making predictions as we enter 2025: a zero visibility age. Trump economic ‘policy’ will likely shape the year. There’s just no tellin’ what will happen.

But before we move on to 2025, some Santa stock market rally housekeeping.

Here’s the history of Santa rallies from 2000 on Seeking Alpha.

As can be seen from the chart, a Santa rally has successfully occurred 18 times out of 24 in the 2000s. One year saw a flat performance, while five years saw a decline, including as recently as 2023.

But so far, Santa read the Trump economic policy and went back into Santa’s house to have a nice hot chocolate. Here’s the equal-weight S&P 500 (RSP), more representative of broader market sentiment.

Or maybe Santa went inside for something a little stronger, perhaps a few hot totties.

And more holiday fun …

Did a rally start last Tuesday? Who knows. True, US and Canadian markets took a big hit down yesterday  with the Dow down 418.5 points or 1% and Nasdaq fell 1.2% (Monday, Dec. 30th). But it doesn’t really matter it’s obvious that 2024 was a wonderful year for investors who stayed the course, stayed invested; for investors who stuck to their investment plan. The final returns for stock markets will simply be statistics for the record books.

Trumpenomics and 2025

In the Globe & Mail John Rapley did a nice summary of the battle between the Fed, bond markets and Donald Trump’s economic ‘policy’. I put policy in quotes because the incoming U.S. President’s platform is currently more threats than anything else.

Here’s a key paragraph …

But it now looks like the Fed may be girding for a battle with the administration, with some governors hinting that they’re beginning to factor the inflationary impact of his policies into their own projections. If they decide to counterbalance a loose fiscal policy with a tight monetary one, the economic prognosis may well change.

Translation: proposed Trump tax cuts and looser regulations will battle with inflationary tariffs and deportations. Add in crippling U.S. debts and deficits. The bond market has been moving rates higher. The stock market (other than the magnificent tech) is moving lower over the last month. Both stocks and bonds are repricing Trump. But Trump is like a box of chocolates – you don’t know you will get.

The zero visibility age

Ian McGugan (also in the Globe & Mail) frames why forecasts are likely to be wrong (again) in this zero visibility age …

The simple explanation for these forecasting failures is that the world has entered some very odd economic territory. Lingering effects of pandemic weirdness, manic exuberance around artificial intelligence and a surprising resurgence of strongman politics are helping to create a thick fog of uncertainty.

It’s a weird mix of optimism, fear and uncomfortable uncertainty that can make you make all kinds of strange (and uncomfortable screwed-up) expressions. Continue Reading…

Franklin Templeton 2025-2035 Outlook: Stocks will beat bonds, EAFE/EM may edge out North American stocks

Stocks are expected to outperform bonds over the next 10 years but EAFE and Emerging Markets will probably do a little better than U.S. and Canadian equities, portfolio managers for Franklin Templeton Investment Solutions told advisors and the media in its 2025 Outlook session held Thursday in Toronto. The twice-annual economic outlook marks the 70th year that Franklin Templeton has operated in Canada: Sir John Templeton’s famous Templeton Growth Fund was launched in Canada in 1954. It has been in the U.S. more than 75 years.

Senior Vice President and Portfolio Manager Ian Riach [pictured left] said in a presentation distributed to attendees that “expected returns for fixed income have become slightly less attractive as yields have moved lower over the past year. EAFE and Emerging market equities [are] expected to outperform U.S and Canadian equities.” The most likely path to stable returns will be through “a diversified and dynamic approach,” he said.

Shorter-term Macro themes

Addressing major shorter-term themes, Riach said the United States continues to lead in Growth, while Canada is improving and the rest of the world is “challenged.” Inflation continues to trend down but some areas are faster than others. Fiscal policy “remains supportive” while “central banks remain data dependent.”

Addressing Canadian economic growth, Riach said Canada’s  inflation backdrop “continues to surprise to the downside” and is now at target levels as leading indicators continue to improve from weak levels. Thus far, Canadians holding mortgages have not yet been impacted by higher interest rates, based on the cumulative share of mortgages outstanding in February 2022 that have been subject to a payment increase.

Economic Growth in Europe and Asia. 

European sentiment is improving but remains at weak levels while Asian manufacturing “has started to fall,” he said. Economic growth in China remains weak: “Consumer sentiment has yet to recover from deteriorating property sector and labor market imbalances.”

Addressing Emerging Markets ex China, Riach said weakening leading manufacturing indicators will “challenge upside potential of cyclical regions broadly.”

In the United States, AI-related stocks (Artificial Intelligence) continue to power U.S. earnings growth expectations. However, Riach said, “this has been broadening to the ‘forgotten 493’ somewhat.” (i.e. away from the Mag 7.)


Inflation much improved

Worldwide, inflation is much improved and is now below Central Bank targets, Riach said.


Asset Allocation

Moving to recommended portfolio positioning, Franklin Templeton is overweight equities, underweight bonds and neutral on Cash. Within stocks, it is overweight Canadian and U.S. equities, Underweight EAFE (Europe Australasia and Far East) and Neutral on Emerging Markets.

The second major presentation was delivered by Jeff Schulze, Head of Economic and Market Strategy for Franklin Templeton’s ClearBridge Investments. Schulze [pictured on right] is known for his “Anatomy of a Recession” analytical work, which assesses 12 variables that historically foreshadow recession.

However, as the chart below shows, the recession dashboard is currently signalling expansion rather than recession:


Addressing employment, Schulze said that while the pace of job creation has slowed substantially over the past few years, “it has settled in line with the pace experienced during the previous economic expansion.” As a result, U.S. consumer spending is robust.
Continue Reading…

Don’t be afraid to take profits


By Dale Roberts, cutthecrapinvesting

Special to Financial Independence Hub

Hit that sell button. It’s not hard. It is likely a good portfolio move whether you are in the accumulation stage, nearing retirement or currently enjoying retirement. Of course, to rebalance your portfolio you have sell and you have to buy. Diversification is the only free lunch when it comes to investing. To remain sensibly diversified we usually have to rebalance to bring our portfolio weights back in line. That means we sell out performing assets and buy the laggards, or at least move those profits to safety. Buy low, sell high right? That is usually the event going on under the hood when we rebalance. Don’t be afraid to take profits, on the Sunday Reads.

Canadian stocks are hitting new all-time highs. Dividends are not included in the chart, below. Remember the dividends paid out will reduce the share price, equal to the value removed to create those dividends.

And it seems like every other week I’m writing about roaring U.S. stocks …

The best year-to-date for U.S. stocks, in decades.

Followed up by this two weeks ago …

U.S. stocks have the best week of the year.

Those who create individual stock portfolios are likely watching some of their stocks go on an incredible run, while others flounder. Seeking Alpha offers some wonderful portfolio trackers that you can customize. Here’s our top winners over the last year.

Rebalancing your stocks

I don’t believe in being too strict with stock weightings, I’ve mostly let my stocks run without rebalancing. But when a stock gets to a certain weight in the portfolio, I will look to trim. Royal Bank of Canada (RBC.TO) and Apple (AAPL) are each near 8% of my RRSP. Sell limit trades have been set for Apple at $240, $250, $260, $270 etc.

I will trim RBC if the stock keeps moving higher. A few shares will be sold next week and I will set a ladder of sell orders as well. Will Apple and RBC hit those targets over the next few months? I have no idea. But if they do, I’m happy to lock in some profits that will go to ultra short term bonds (cash like) or to underweight stocks. As I’m in semi-retirement, any profits held in the ultra short bonds are ready for spending. It’s easy and enjoyable to create retirement income from share sales.

Some will suggest that we should not let individual stocks get above a 5% portfolio weighting. It’s a personal choice and I will leave that up to you. In my wife’s spousal RRSP Berkshire Hathaway is over 35% of the portfolio. I have no plans to sell, quite the opposite, given that the stock is a conglomerate and more like ‘balanced’ fund compared to a typical individual stock. Plus, Berkshire holds about $325 billion in cash, it’s more like a balanced growth portfolio. There can be special situations, and you might have a very strong conviction for an individual stock. That said, understand the concentration risks.

More on – When should we rebalance our portfolio.

Who knew that Canada’s ‘safe’ telco sector would come under attack. I have been hurt by decent weights in Telus and Bell. I sold half of my Bell stock, and then I sold the rest.

Rebalancing your ETF Portfolio

If you hold a core ETF portfolio you might simply rebalance one a year. The need to rebalance could be that your stock to bond ratio (risk level) is out of whack. We’re then selling stocks and buying bonds. And given the meteoric rise of U.S. stocks over everything else, your portfolio geographic map is likely tilted towards one country. We’re selling U.S. and buying Canada or International.

You might choose to rebalance based on bands. For example, if the U.S. stock target is 40% and it has moved to 45%, find that sell button. You may choose 50% as a band target (or other) once again, that’s up to you, but have a plan and execute.

In the accumulation stage you have the opportunity to rebalance on the fly. New monies and portfolio income can be used to buy underperforming assets. Those ongoing investments might be able keep things in line, or at least reduce the portfolio drift.

Managing your capital gains and losses

Yes, for those with taxable accounts it’s time to ‘take advantage’ of your portfolio dogs – goodbye Bell Canada and Algonquin. Feel free to discuss your losers in the comment section of this post. Think of it as stock therapy 😉 It’s tax loss harvesting season. Continue Reading…